Physisorption and Chemisorption General Trends Analysis
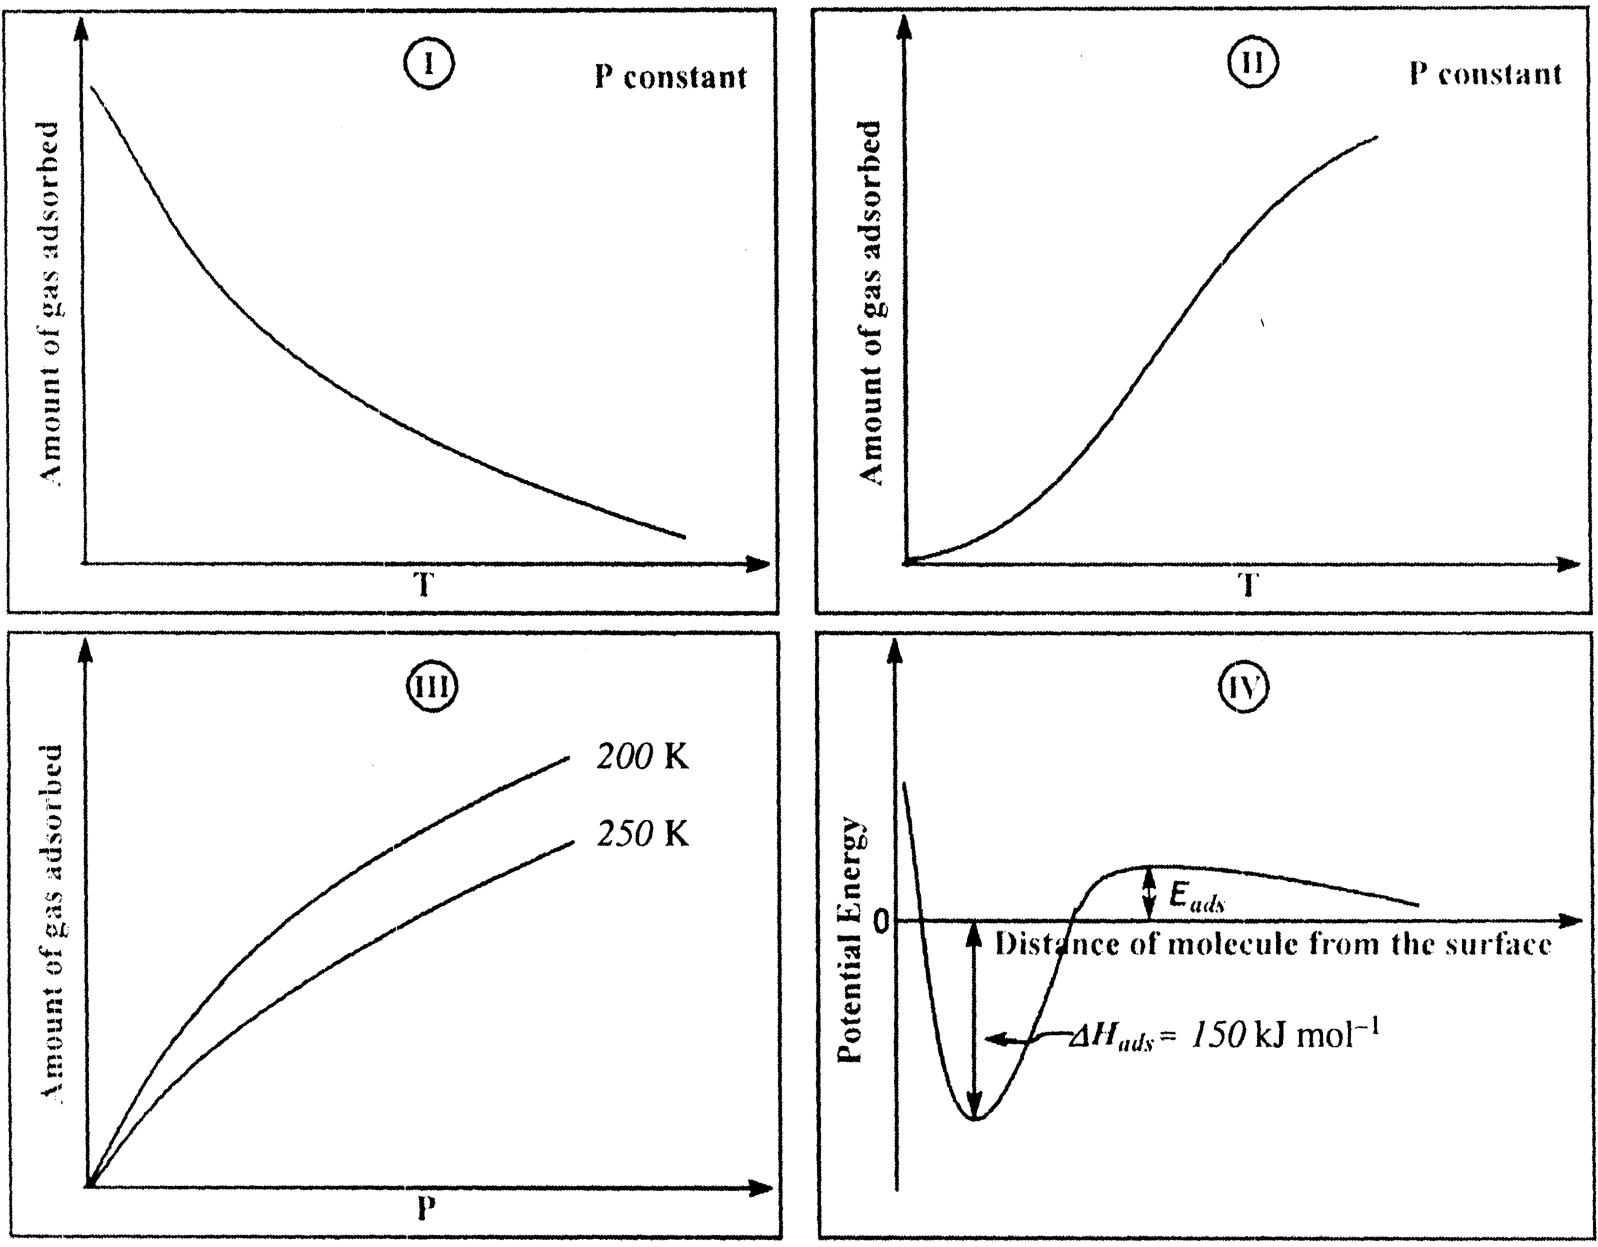
The given graphs / data , , and represent general trends observed for different physisorption and chemisorption processes under mild conditions of temperature and pressure. Which of the following choice(s) about , , and is (are) correct?
Options
ACorrect
is physisorption and is chemisorption
B
is physisorption and is chemisorption
CCorrect
is chemisorption and is chemisorption
D
is chemisorption and is chemisorption
Topics & Concepts
Step-by-Step Solution
To determine the correct choice(s), we analyze each graph/data representation individually based on the principles of physisorption (physical adsorption) and chemisorption (chemical adsorption):
-
Analysis of Graph I:
- Type: Adsorption isobar (Amount of gas adsorbed vs. Temperature at constant Pressure ).
- Observation: The amount of gas adsorbed continuously decreases as the temperature increases.
- Reasoning: Physisorption is an exothermic process () involving weak van der Waals forces and does not require activation energy. According to Le Chatelier's principle, an increase in temperature shifts the equilibrium backward, decreasing the extent of adsorption continuously.
- Conclusion: represents physisorption.
-
Analysis of Graph II:
- Type: Adsorption isobar (Amount of gas adsorbed vs. Temperature at constant Pressure ).
- Observation: The amount of gas adsorbed initially increases with an increase in temperature.
- Reasoning: Chemisorption involves chemical bond formation between the adsorbate and adsorbent, which requires an activation energy (). Increasing temperature supplies the required activation energy, leading to an initial increase in the amount of gas adsorbed.
- Conclusion: represents chemisorption.
-
Analysis of Graph III:
- Type: Adsorption isotherms (Amount of gas adsorbed vs. Pressure at constant temperatures).
- Observation: At any constant pressure , the curve for lies above the curve for . That is, the amount of gas adsorbed decreases as the temperature increases ().
- Reasoning: Since the extent of adsorption decreases with an increase in temperature at a given pressure, it represents an exothermic process without an activation energy barrier.
- Conclusion: represents physisorption.
-
Analysis of Graph IV:
- Type: Potential energy profile vs. distance from the surface.
- Observation: The graph shows an activation energy barrier () and a high magnitude of heat of adsorption ().
- Reasoning: The heat of physisorption is typically low (), whereas the enthalpy of chemisorption is high (). Furthermore, the presence of an energy barrier () is characteristic of chemical bond formation.
- Conclusion: represents chemisorption.
Evaluation of Options:
- (A) is physisorption and is chemisorption: Correct, since is physisorption and is chemisorption.
- (B) is physisorption and is chemisorption: Incorrect, since is physisorption.
- (C) is chemisorption and is chemisorption: Correct, since both and are chemisorption.
- (D) is chemisorption and is chemisorption: Incorrect, since is physisorption.
Correct Options: A and C