Match Column Parameters with Graph Representations in Physics Experiments
Column I gives a list of possible set of parameters measured in some experiments. The variations of the parameters in the form of graphs are shown in Column II. Match the set of parameters given in Column I with the graphs given in Column II. Indicate your answer by darkening the appropriate bubbles of the matrix given in the ORS.
Column I
(A) Potential energy of a simple pendulum (-axis) as a function of displacement (-axis)
(B) Displacement (-axis) as a function of time (-axis) for a one dimensional motion at zero or constant acceleration when the body is moving along the positive -direction
(C) Range of a projectile (-axis) as a function of its velocity (-axis) when projected at a fixed angle
(D) The square of the time period (-axis) of a simple pendulum as a function of its length (-axis)
Column II
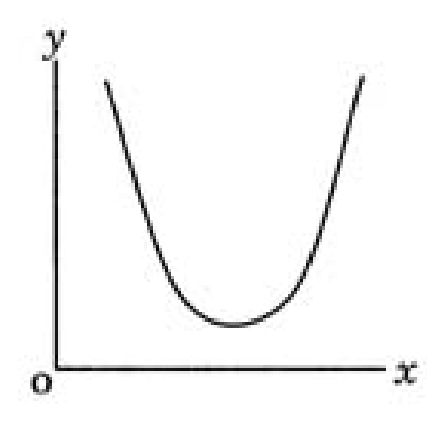
(p)
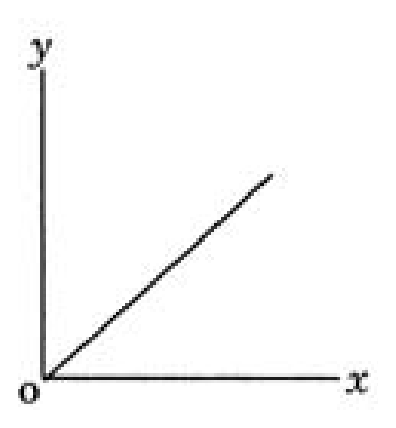
(q)
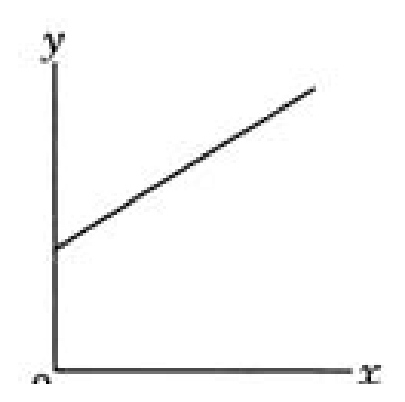
(r)
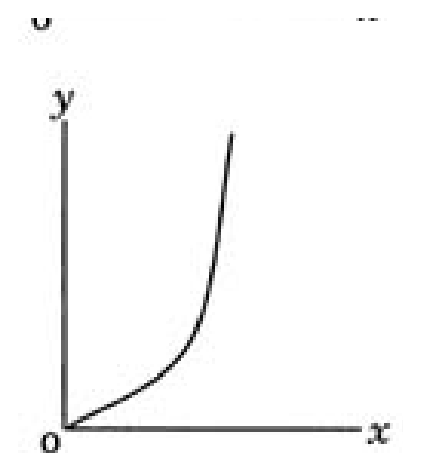
(s)
Options
Topics & Concepts
Step-by-Step Solution
To match the parameters in Column I with the corresponding graph representations in Column II, let us analyze each statement mathematically:
(A) Potential energy of a simple pendulum (-axis) as a function of displacement (-axis)
For small oscillations, the potential energy of a simple pendulum at a displacement from its equilibrium position is given by:
where is the potential energy at the mean position (), is the mass, and is the angular frequency.
- Graphical representation:
Here, and is the displacement. The relation is quadratic of the form (), which represents a parabola opening upwards with its minimum (vertex) located at a non-zero positive value on the -axis (). - This uniquely matches graph (p).
(B) Displacement (-axis) as a function of time (-axis) for a one-dimensional motion at zero or constant acceleration when the body is moving along the positive -direction
The position or displacement as a function of time (here -axis) is given by the equation of motion:
-
Zero acceleration ():
- If the initial displacement , then , which is a straight line passing through the origin with a positive slope (). This corresponds to graph (q).
- If the initial displacement , then , which is a straight line with a positive -intercept and a positive slope. This corresponds to graph (r).
-
Constant positive acceleration ():
- If initial position and initial velocity , then , which represents a parabola passing through the origin and opening upwards in the first quadrant. This corresponds to graph (s).
(C) Range of a projectile (-axis) as a function of its velocity (-axis) when projected at a fixed angle
The horizontal range of a projectile launched with initial velocity at a fixed angle to the horizontal is:
- Graphical representation:
Let and . The relationship becomes:
This is the equation of a parabola opening upwards and passing through the origin . - This corresponds to graph (s).
(D) The square of the time period (-axis) of a simple pendulum as a function of its length (-axis)
The time period of a simple pendulum of length is given by:
Squaring both sides gives:
- Graphical representation:
Let and . The relationship becomes:
This is a straight line passing through the origin with a positive slope. - This corresponds to graph (q).
Final Match:
- A p
- B q, r, s
- C s
- D q