Vapour Pressure versus Temperature Plot for Ethanol Solution Freezing Point
Pure water freezes at and . Adding of ethanol into of water alters the freezing point of the resultant solution. Take the molal freezing point depression constant of water to be . Plots of vapour pressure (V.P.) against temperature (T) are shown below. [Molar mass of ethanol = ] Select the plot that correctly depicts the shift in freezing point.
Options
Topics & Concepts
Step-by-Step Solution
To determine the correct plot depicting the shift in the freezing point, we perform the following step-by-step calculations and thermodynamic analysis:
1. Calculation of the Freezing Point of the Solution
Step A: Calculate the moles of ethanol (solute)
Step B: Calculate the molality of the solution ()
Step C: Calculate the depression in freezing point () Given :
Step D: Calculate the new freezing point ()
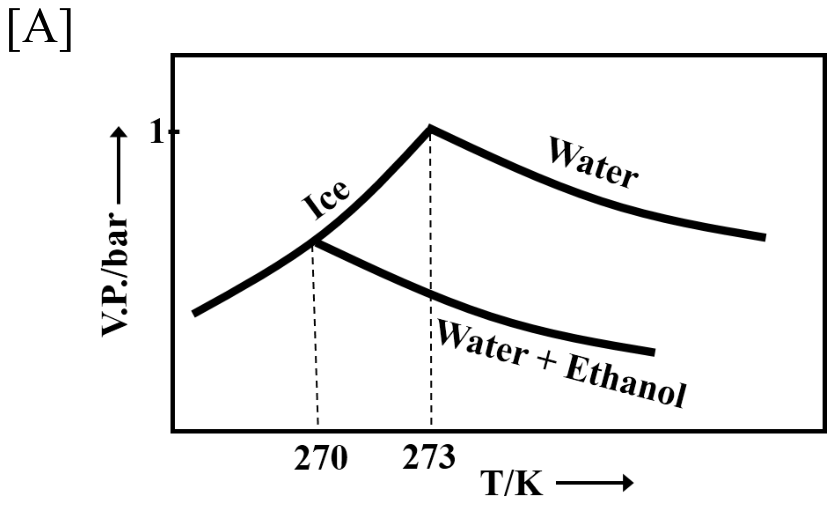
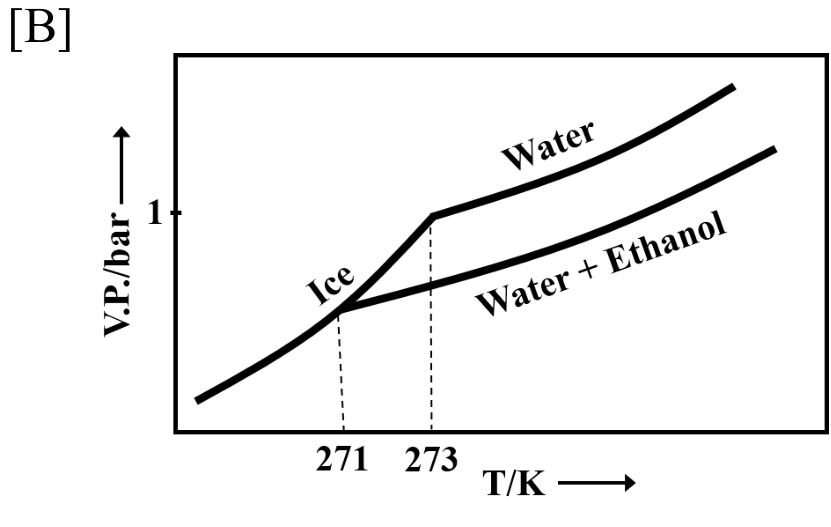
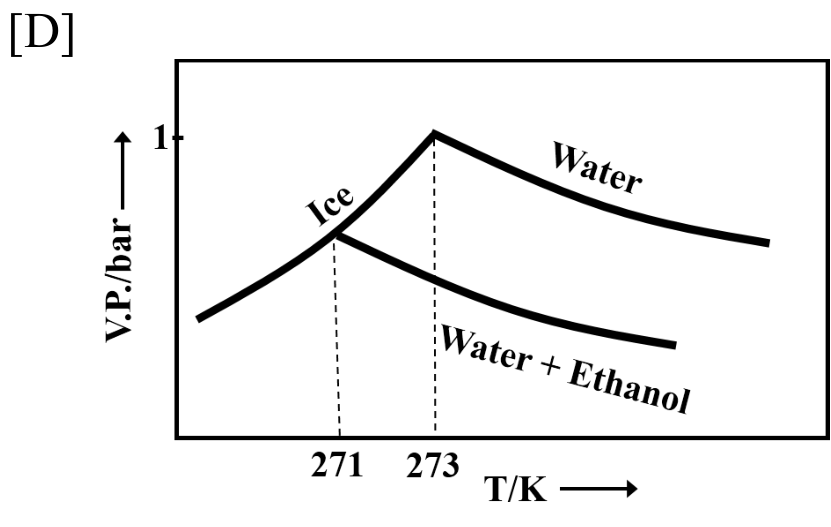
This eliminates options [B] and [D], as they show a freezing point of .
2. Analysis of the Vapour Pressure vs. Temperature Curves
- The freezing point is the temperature at which the vapour pressure of the liquid phase equals the vapour pressure of the solid phase (ice).
- According to the Clausius-Clapeyron equation, the vapour pressure of both solid and liquid states increases monotonically with an increase in temperature (). Therefore, the slope of the vapour pressure curves for pure water, ice, and the solution must be positive.
- Option [A] incorrectly shows the vapour pressure of liquid water decreasing as temperature increases (negative slope).
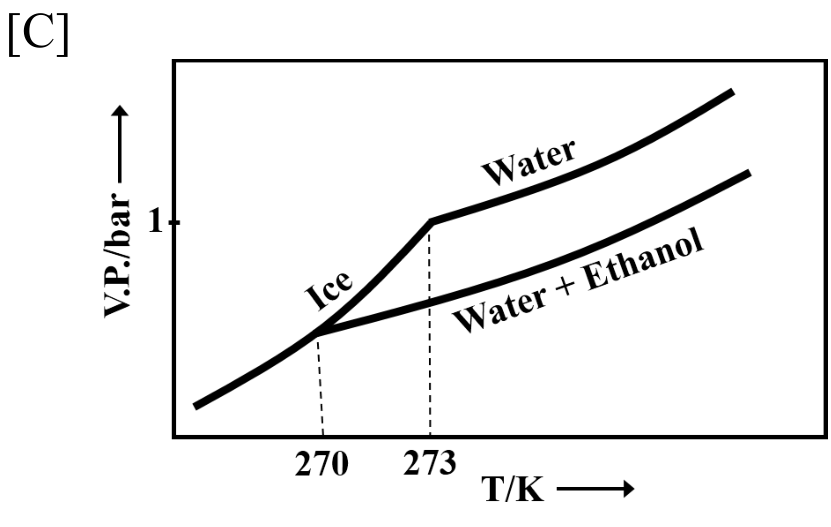
- Option [C] correctly shows:
- Positive slopes for all vapour pressure curves (Ice, Pure Water, and Water + Ethanol solution).
- The vapour pressure curve of the solution lying below that of pure water (lowering of vapour pressure).
- The intersection of the ice curve with the solution curve at (the depressed freezing point) and with the pure water curve at .
Thus, the plot in Option C correctly depicts the shift in freezing point.
Correct Option: C