Torque on Rotating Rod with Crawling Insect
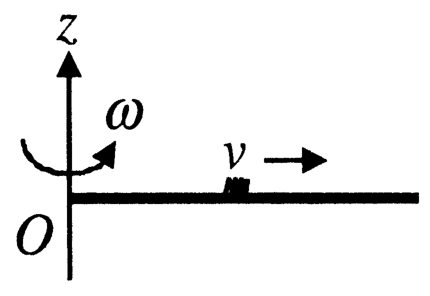
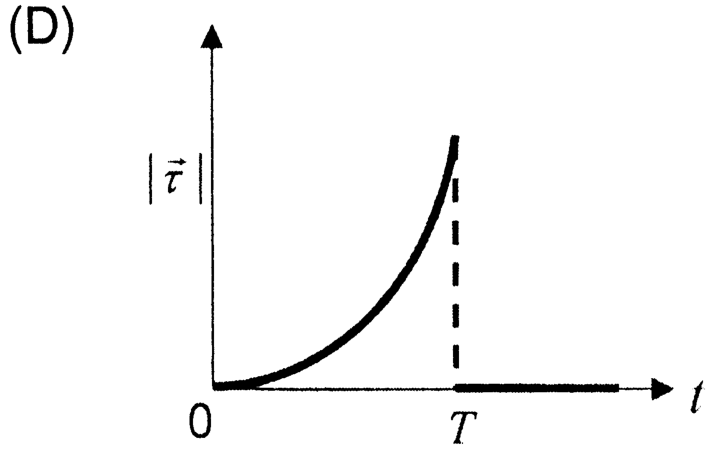
A thin uniform rod, pivoted at , rotates in a horizontal plane with a constant angular speed , as depicted in the figure. At time , a small insect starts from and crawls with a constant speed relative to the rod toward the other end. It arrives at the end of the rod at time and stops. The angular speed of the assembly is maintained at throughout. The variation of the magnitude of the torque acting on the system about as a function of time is best depicted by which graph?
Options
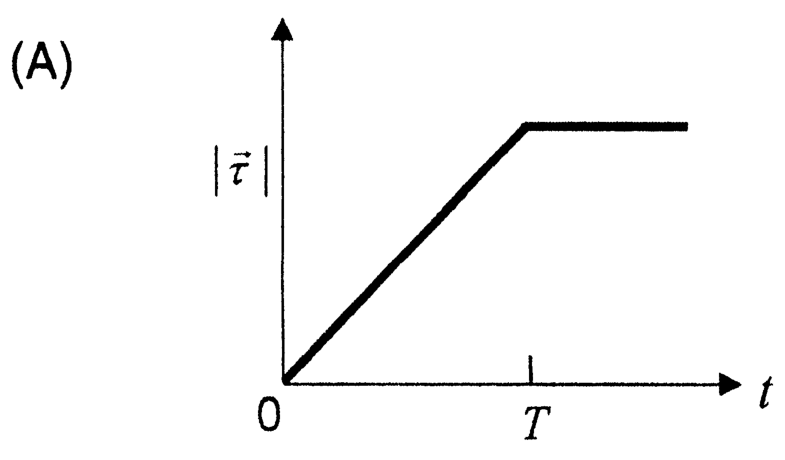
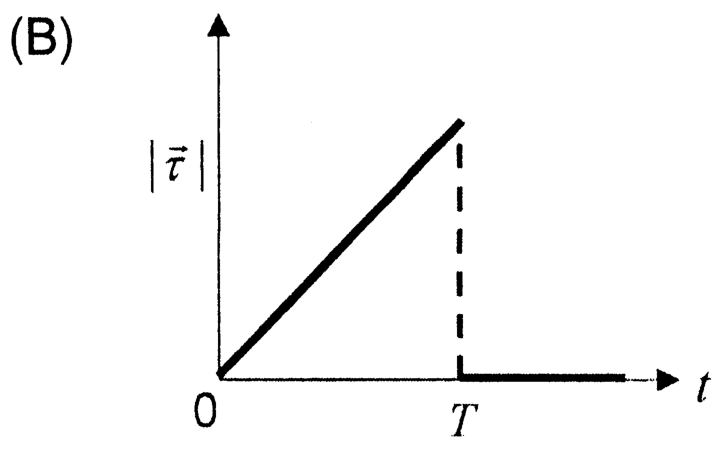
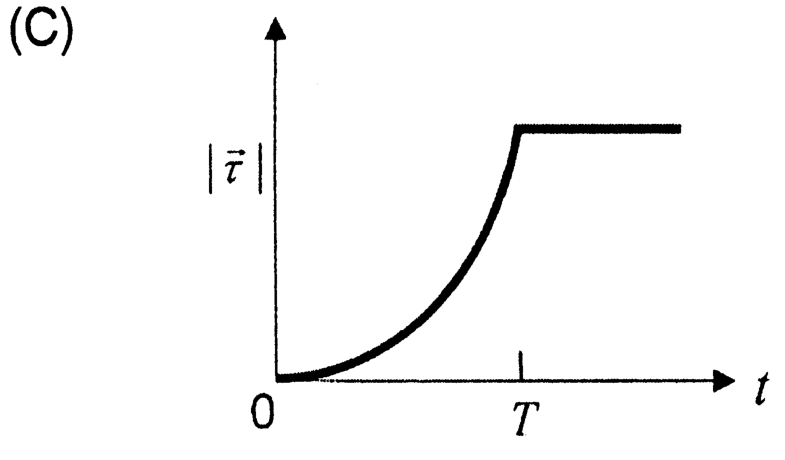
Topics & Concepts
Step-by-Step Solution
To determine the variation of the magnitude of the torque () acting on the system about as a function of time , we analyze the angular momentum of the system.
1. Angular Momentum of the System
The total angular momentum of the system about the pivot consists of the angular momentum of the rod and the angular momentum of the crawling insect:
-
For the rod: Since the rod is uniform and rotates with a constant angular velocity , its angular momentum about is constant:
-
For the insect during : The insect moves with a constant relative speed along the rod. Its position vector relative to at time is:
The velocity of the insect in polar coordinates is:
The angular momentum of the insect about is:
Thus, for , the total angular momentum of the system is:
2. Calculation of Torque
The net torque required to maintain the rotation at a constant angular speed is given by the rate of change of total angular momentum:
-
For :
The magnitude of the torque is:
This shows that varies linearly with time during the interval , starting from at and reaching a maximum value of at .
-
For : At , the insect reaches the end of the rod and stops crawling relative to the rod. Thereafter, its distance from remains constant (). The total moment of inertia of the system becomes constant:
Since and are both constant, the total angular momentum becomes constant, which implies:
Conclusion
- From to , increases linearly with .
- For , drops immediately to zero.
This behavior is correctly depicted by the graph in option (B).
Correct Option: B