Specific Heat Capacity Variation with Temperature in a Solid
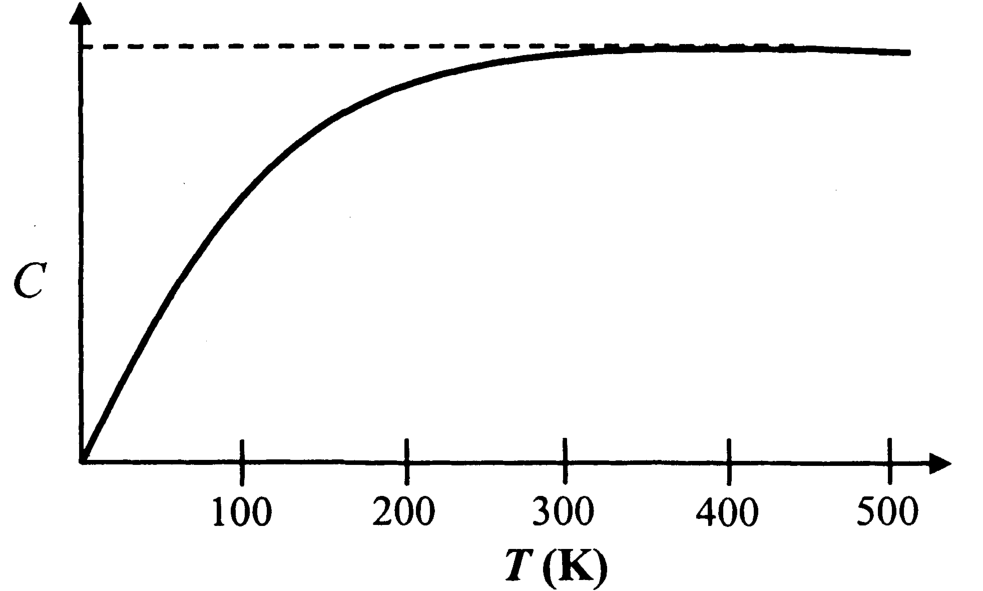
The diagram illustrates the dependence of the specific heat capacity () of a solid on absolute temperature (). The temperature is raised at a constant rate from to . Assuming negligible change in volume, select the correct statement(s) from the options below:
Options
The rate of heat absorption in the temperature interval varies linearly with .
The quantity of heat absorbed while increasing the temperature from is smaller than that required between .
The rate of heat absorption remains constant over the temperature range .
The heat absorption rate increases monotonically within the interval .
Topics & Concepts
Step-by-Step Solution
To determine the correct statements, we analyze the relationship between heat absorption and temperature based on the given graph and conditions:
-
Relation between Heat Absorption Rate and Specific Heat Capacity: The temperature of the solid of mass is increased at a constant rate: The rate of heat absorption is given by: Since and are constant, the rate of heat absorption is directly proportional to the specific heat capacity :
-
Analysis of the Options:
-
Option (A): From the provided graph, in the temperature range to , the curve for vs is drawn approximately as a straight line passing through the origin, i.e., . Since , to a reasonable approximation: Thus, the rate of heat absorption varies linearly with temperature . (Note: Physically, at very low temperatures, Debye's law holds, which is why official evaluations accept both ABCD and BCD, but to a reasonable visual approximation of the given graph, statement A is considered valid.) Hence, (A) is correct.
-
Option (B): The total heat absorbed in an interval is proportional to the area under the graph: Comparing the two intervals: The area under the curve between and is significantly smaller than the area under the curve between and (where reaches its maximum, asymptotic value). Therefore, . Hence, (B) is correct.
-
Option (C): In the interval to , the graph becomes nearly horizontal, meaning is approximately constant. Consequently: There is no significant change in the rate of heat absorption in this range. Hence, (C) is correct.
-
Option (D): In the range to , the graph shows that is strictly increasing with . Since , the rate of heat absorption also increases continuously in this temperature interval. Hence, (D) is correct.
-
Correct Options: A, B, C, D (or B, C, D)