Resistance Variation of Superconductor in Magnetic Fields
Electrical resistance of certain materials, known as superconductors, changes abruptly from a nonzero value to zero as their temperature is lowered below a critical temperature . An interesting property of superconductors is that their critical temperature becomes smaller than if they are placed in a magnetic field, i.e., the critical temperature is a function of the magnetic field strength . The dependence of on is shown in the figure.
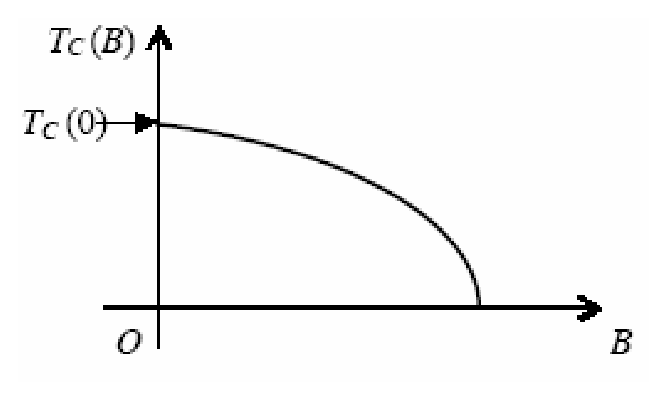
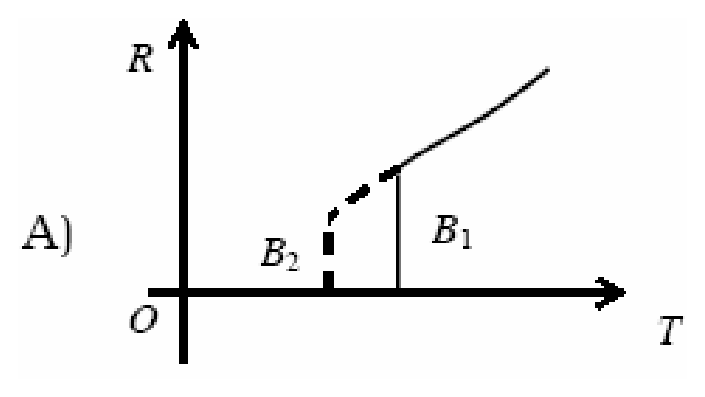
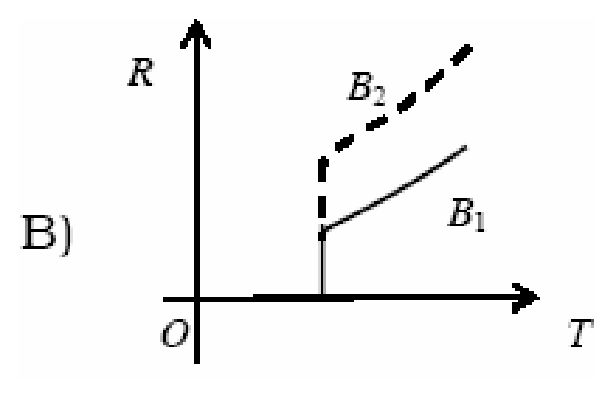
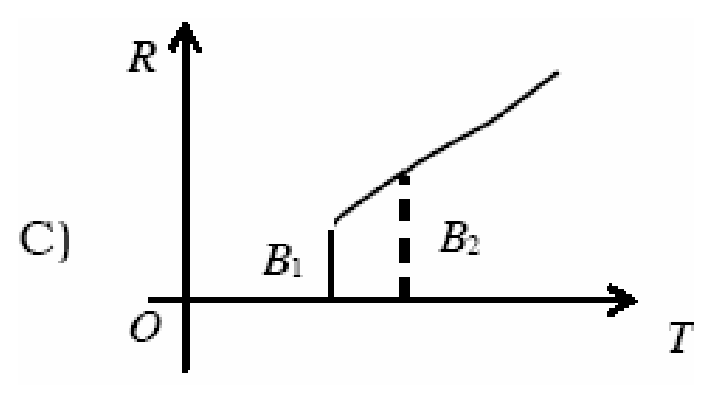
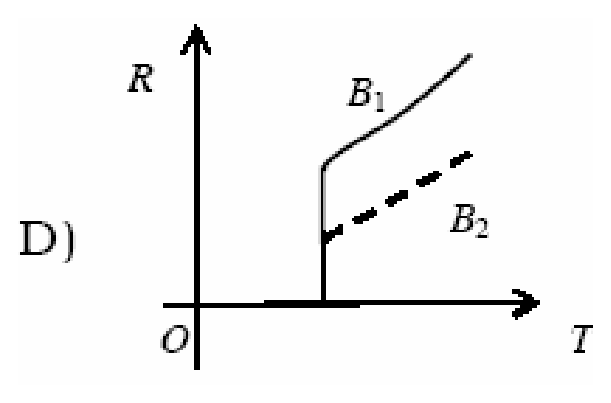
In the graphs below, the resistance R of a superconductor is shown as a function of its temperature T for two different magnetic fields (solid line) and (dashed line). If is larger than , which of the following graphs shows the correct variation of R with T in these fields ?
Options
Topics & Concepts
Step-by-Step Solution
Based on the provided passage and principles of superconductivity:
-
Dependence of Critical Temperature on Magnetic Field:
The critical temperature of a superconductor decreases as the applied magnetic field strength increases.
Mathematically, if , then:
-
Resistance as a Function of Temperature:
A material behaves as a superconductor (having zero electrical resistance, ) when its temperature is strictly less than its critical temperature for a given magnetic field :- For magnetic field : for , and for .
- For magnetic field : for , and for .
-
Comparison of Transition Points:
Since , the critical temperature for field (dashed line) must lie to the left of for field (solid line) on the temperature () axis. -
Evaluating the Options:
- Graph A: Shows the abrupt drop in resistance for the dashed line () occurring at a lower temperature than that for the solid line (), i.e., .
- Graph C: Incorrectly shows .
- Graphs B and D: Incorrectly represent the normal state resistance and transition behavior.
Therefore, the correct variation of with is given by option A.