Relative Speed Between Opposite Points on Two Rotating Discs
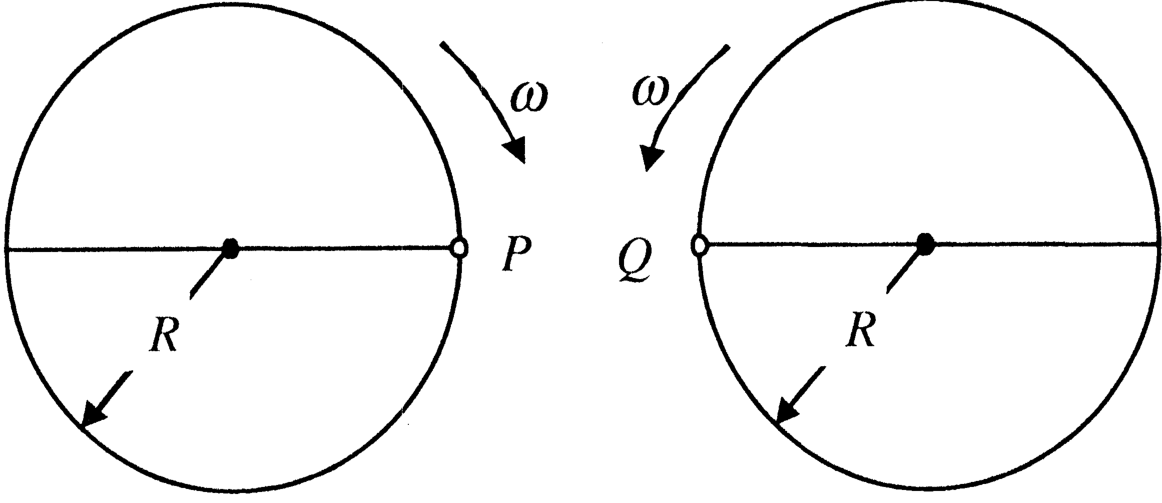
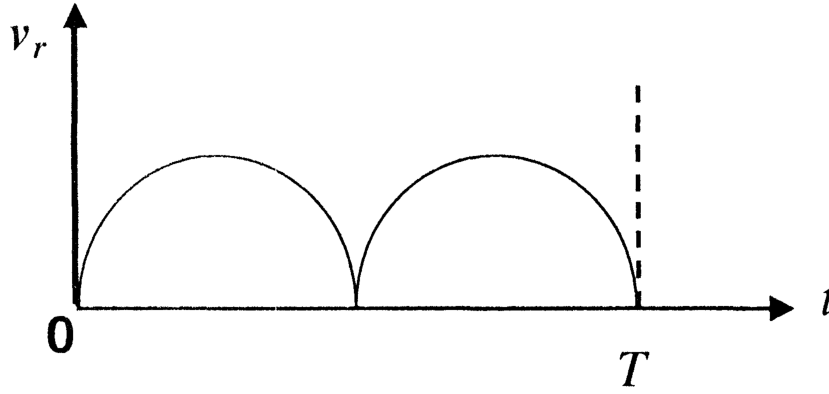
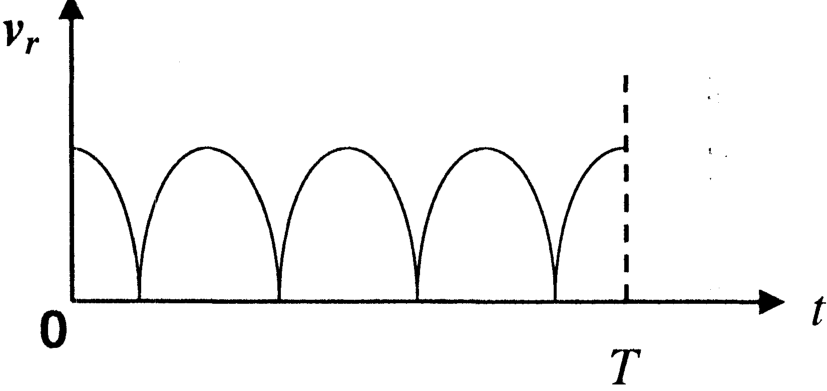
Two identical circular discs of radius rotate about their central axes in opposite directions with identical constant angular speed . Both discs lie in the same horizontal plane. At initial time , points and on the respective circumferences directly face each other as depicted in the figure. Let be the magnitude of the relative velocity between points and . Which of the following graphs best represents as a function of time over one full period of rotation ?
Options
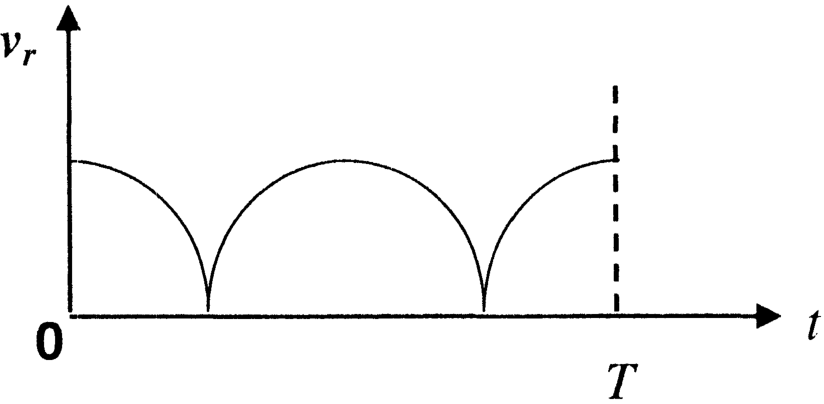
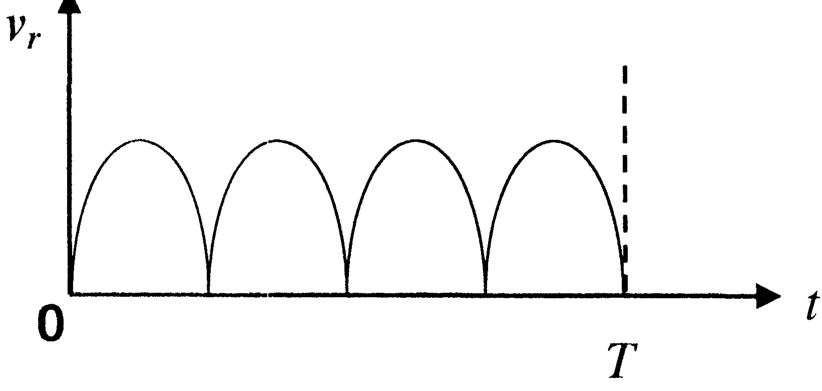
Topics & Concepts
Step-by-Step Solution
To determine the correct graph representing the magnitude of the relative velocity between points and as a function of time , we can set up a Cartesian coordinate system with the horizontal axis aligned along the line connecting the centers of the two discs, and the vertical axis perpendicular to it.
Let the center of the left disc be and the center of the right disc be .
1. Kinematics of Points and
At :
- Point lies on the rightmost edge of the left disc. Its initial angular position relative to is .
- Point lies on the leftmost edge of the right disc. Its initial angular position relative to is .
The two discs rotate in opposite directions with constant angular speed . Without loss of generality, assume the left disc rotates counter-clockwise and the right disc rotates clockwise.
-
For point on the left disc (counter-clockwise rotation): Differentiating with respect to time , the velocity vector of point is:
-
For point on the right disc (clockwise rotation): Differentiating with respect to time , the velocity vector of point is:
2. Relative Velocity and Relative Speed
layout The relative velocity vector between points and is:
The magnitude of the relative velocity (relative speed) is given by:
3. Behavior Over One Full Period
Since the time period of rotation is , we evaluate at key intervals:
- At :
- At :
- At :
- At :
- At :
Thus, consists of two positive semi-sinusoidal lobes (humps) over one full period , starting and ending at zero. This profile is correctly represented in graph (A).
Correct Option: A