Plot Following Arrhenius Equation for Rate Constant Variation
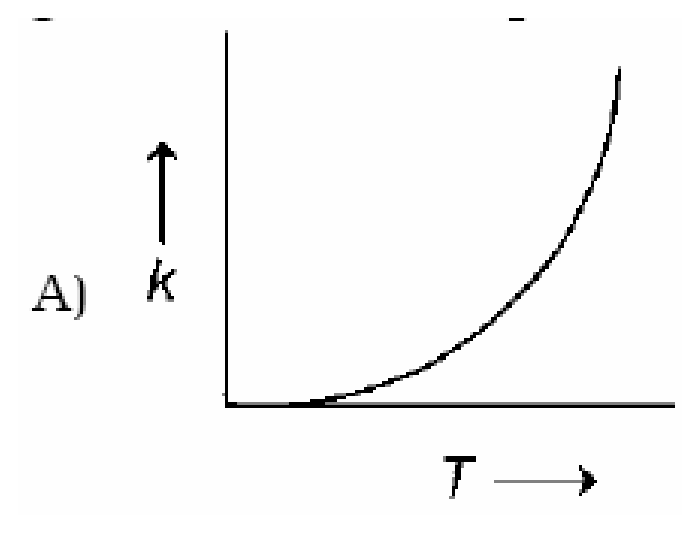
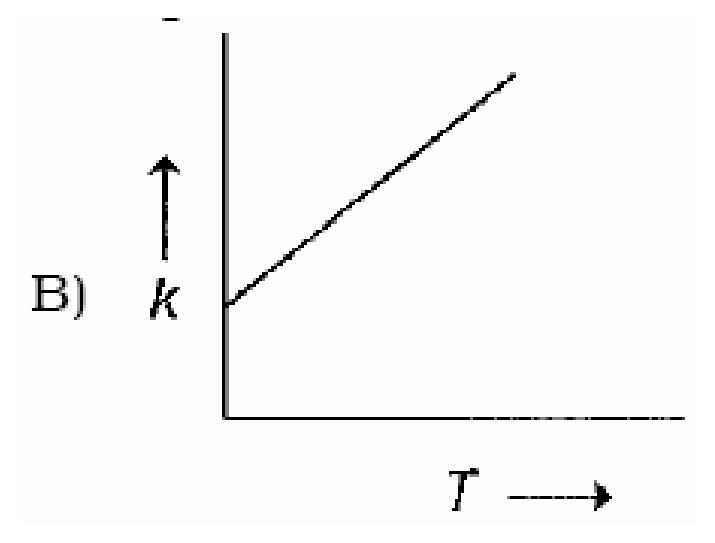
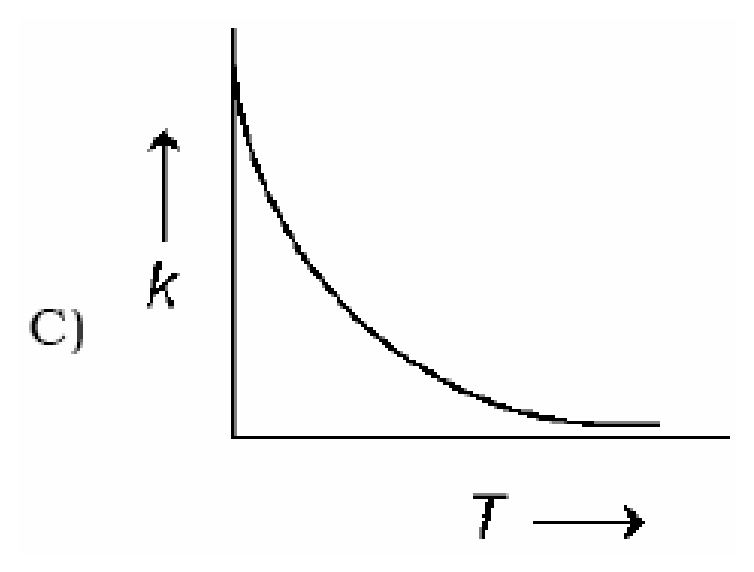
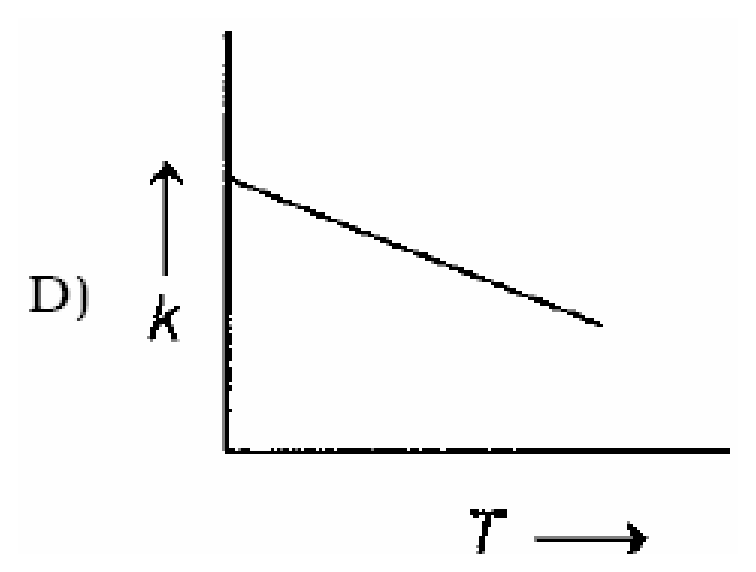
Plots showing the variation of the rate constant (k) with temperature (T) are given below. The plot that follows Arrhenius equation is
Options
Topics & Concepts
Step-by-Step Solution
According to the Arrhenius equation, the dependence of the rate constant on temperature (in Kelvin) is given by:
where:
- is the pre-exponential factor (frequency factor),
- is the activation energy ( for typical reactions),
- is the universal gas constant,
- is the absolute temperature.
Let us analyze the behavior of as a function of :
-
Boundary Limits:
- As , , which gives:
- As , , which gives:
- As , , which gives:
-
First Derivative (Slope):
Since , , and , we have:
This indicates that the rate constant increases monotonically with an increase in temperature . This immediately rules out options (C) and (D), where decreases. -
Second Derivative (Curvature):
For conventional chemical reactions, is of the order of tens to hundreds of , making at practically accessible temperatures. Thus:
This implies that the plot of versus is concave upward (exhibiting an exponential-like increase) and non-linear, which rules out the straight line in option (B).
Therefore, plot (A) accurately depicts the variation of with according to the Arrhenius equation.
Correct Answer: A