Phase Space Diagram for Ball Thrown Vertically Upward
Paragraph for Question Nos. 35 to 37
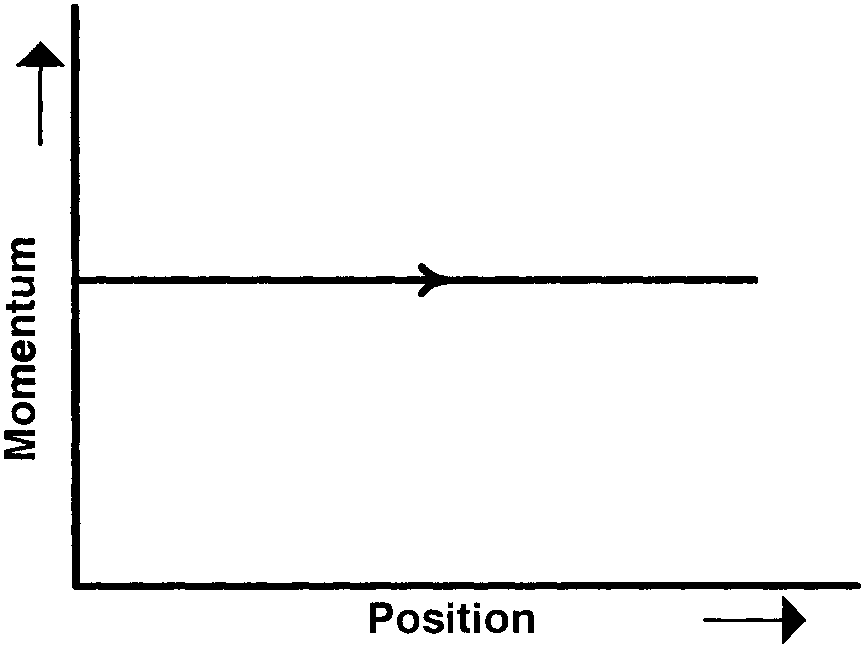
Phase space diagrams are useful tools in analyzing all kinds of dynamical problems. They are especially useful in studying the changes in motion as initial position and momentum are changed. Here we consider some simple dynamical systems in one-dimension. For such systems, phase space is a plane in which position is plotted along horizontal axis and momentum is plotted along vertical axis. The phase space diagram is vs. curve in this plane. The arrow on the curve indicates the time flow. For example, the phase space diagram for a particle moving with constant velocity is a straight line as shown in the figure. We use the sign convention in which position or momentum upwards (or to right) is positive and downwards (or to left) is negative.
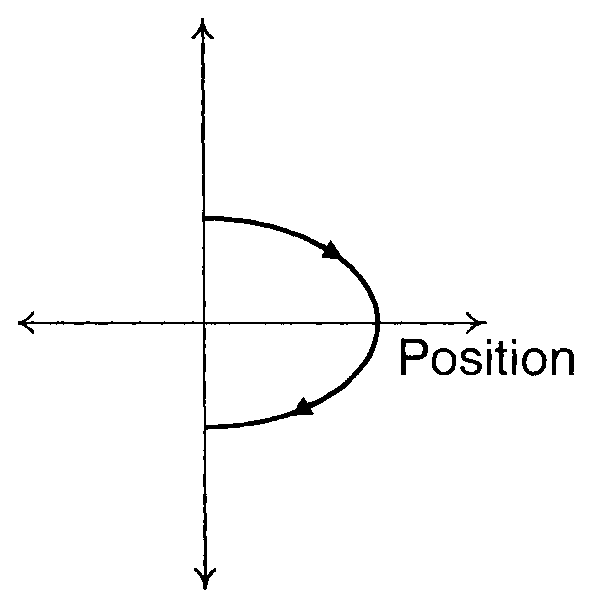
The phase space diagram for a ball thrown vertically up from ground is
Options
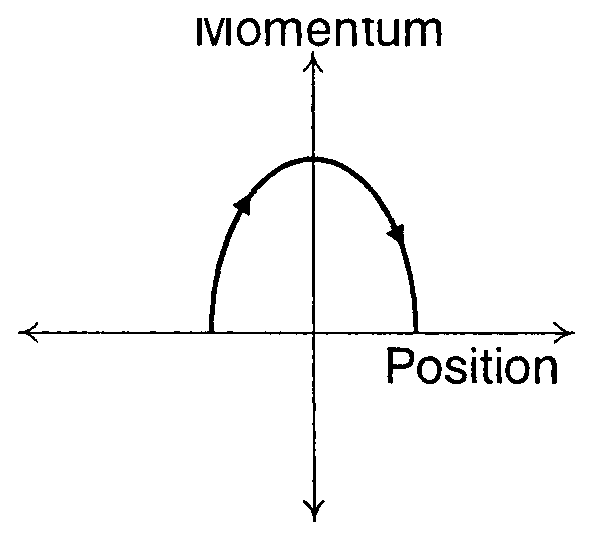
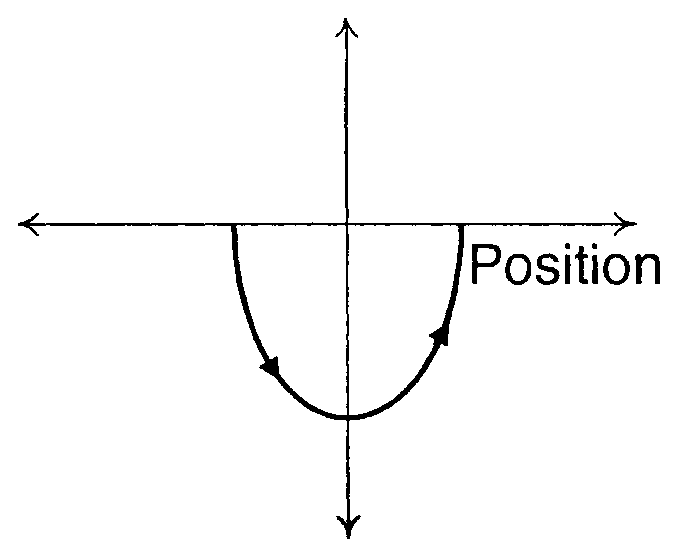
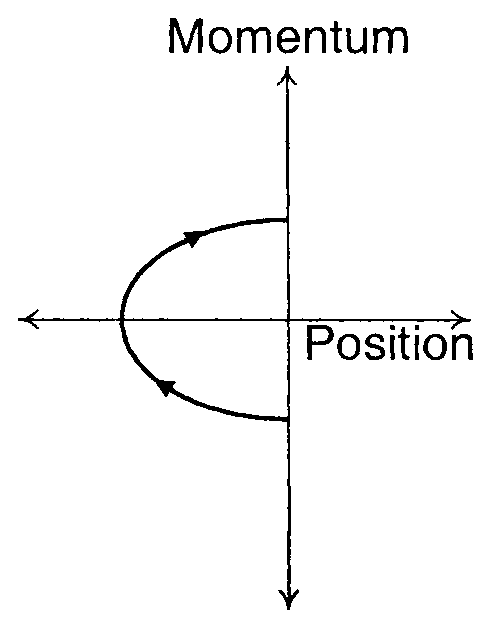
Topics & Concepts
Step-by-Step Solution
To determine the correct phase space diagram for a ball thrown vertically upward from the ground, we analyze the relationship between its position and momentum over time.
1. Governing Equations of Motion
Let:
- Ground level be , with the upward direction taken as positive ().
- be the mass of the ball.
- be the initial upward velocity, giving an initial momentum .
By conservation of total mechanical energy :
At , the ball is at with initial momentum , so the total energy is:
Equating the two expressions for total energy:
Solving for position as a function of momentum :
2. Analysis of the Curve in Phase Space ( vs )
-
Shape of the Curve:
The relationship represents a parabola opening to the left (towards negative ) in the phase space plane, with its vertex located at:
-
Domain of Position:
Since the ball is thrown from the ground and remains above ground throughout its flight, at all times.
3. Time Evolution (Direction of Arrows)
-
Ascent Phase ():
- Initial State (): The ball starts at the ground () with positive momentum ().
- Motion: As the ball moves upward, its position increases from to , while its velocity and momentum decrease from to .
- Trajectory in Phase Space: The state moves through the first quadrant () from to the vertex . The arrow points downwards and to the right.
-
Maximum Height ():
- The ball reaches its peak height where .
-
Descent Phase ():
- Motion: As the ball falls back down, its position decreases from back to . The momentum becomes negative, decreasing from to .
- Trajectory in Phase Space: The state moves through the fourth quadrant () from to . The arrow points downwards and to the left.
Conclusion
The phase space diagram is a parabolic arc located entirely in the region , starting on the positive vertical axis at , looping through positive to reach the horizontal axis at , and returning to the negative vertical axis at in a clockwise manner.
This description uniquely corresponds to Option D.