Molar Conductivity Variation and Micelle Formation of Sodium Stearate
The molar conductivity () for an aqueous solution of sodium stearate, acting as a strong electrolyte, was measured across different concentrations (). Which of the following graphs accurately represents the micelle formation behavior in solution? (The critical micelle concentration (CMC) is indicated by an arrow in each plot.)
Options
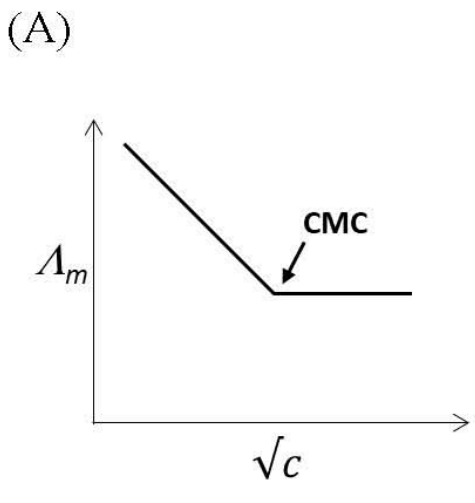
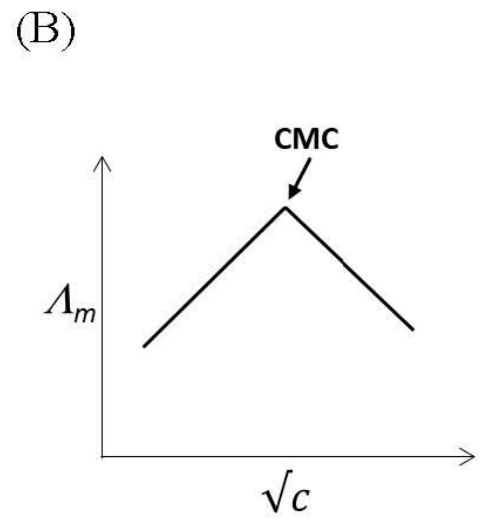
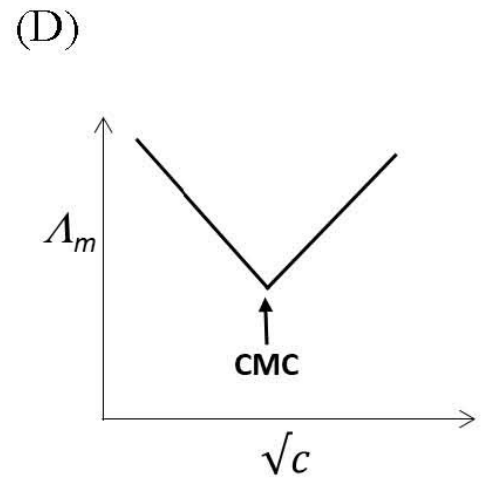
Topics & Concepts
Step-by-Step Solution
Sodium stearate () is a surface-active agent (surfactant) that behaves as a strong electrolyte at low concentrations and forms aggregated colloids (micelles) above a threshold concentration known as the Critical Micelle Concentration (CMC).
1. Behavior Below CMC ():
At very low concentrations (), sodium stearate completely dissociates into individual sodium ions () and stearate ions ():
As a strong electrolyte, its molar conductivity () follows the Debye-Hückel-Onsager equation: where is the limiting molar conductivity at infinite dilution and is a constant. Thus, as the concentration (or ) increases, interionic attraction increases moderately, causing to decrease linearly with a characteristic mild negative slope.
2. Behavior At and Above CMC ():
When the concentration reaches the CMC, the hydrophobic hydrocarbon chains () aggregate together to minimize contact with water, forming spherical clusters called micelles.
Upon micelle formation:
- Reduction in Free Ions: A large number of individual stearate ions (typically ) aggregate into a single micellar species, drastically reducing the total number of independent charge-carrying particles per mole of surfactant.
- Counter-Ion Binding: A significant fraction of ions bind to the charged hydrophilic heads () on the surface of the micelle due to strong electrostatic attraction. This reduces the effective concentration of free ions available for electrical conduction.
- Decreased Ionic Mobility: The large size of the micelle reduces its overall mobility compared to individual small monomer ions.
Conclusion:
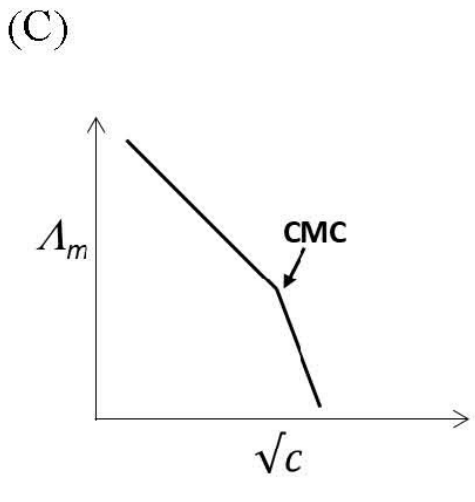
Because of the sudden decrease in the effective number of free charge carriers and counter-ion binding at concentrations exceeding the CMC, the molar conductivity () drops much more sharply as increases beyond the CMC.
Therefore, the graph of versus shows a linear decrease with a moderate negative slope below CMC, followed by a steeper negative slope above CMC.
This behavior is correctly depicted in Option (C).