Kinetic Energy versus Time for Bouncing Elastic Ball
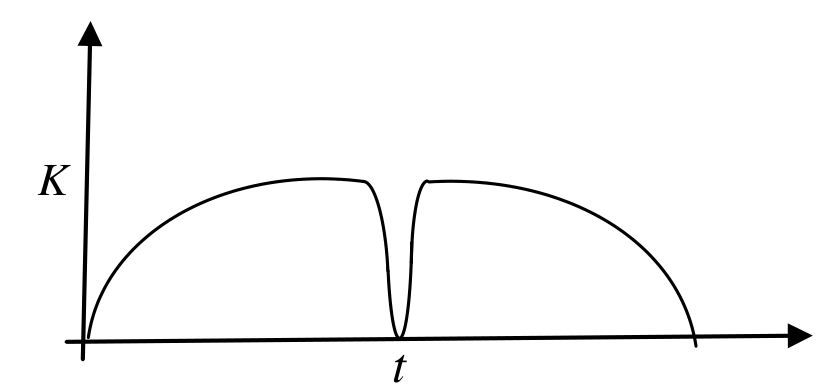
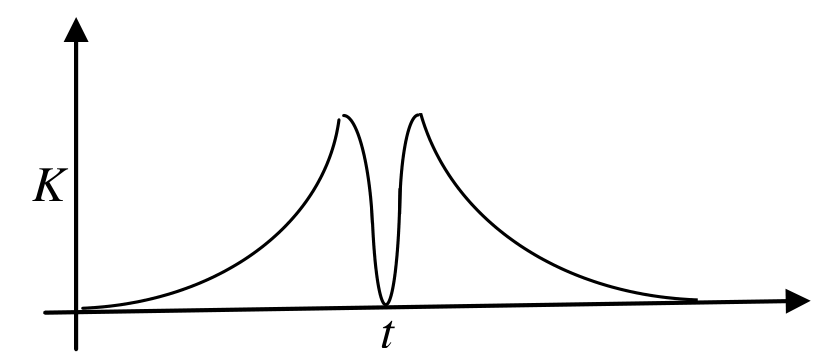
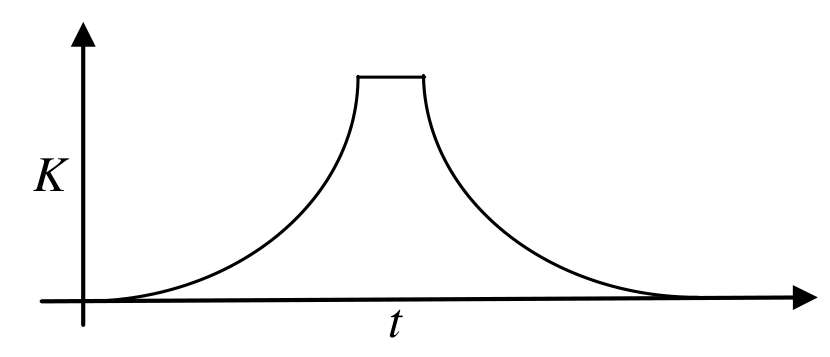
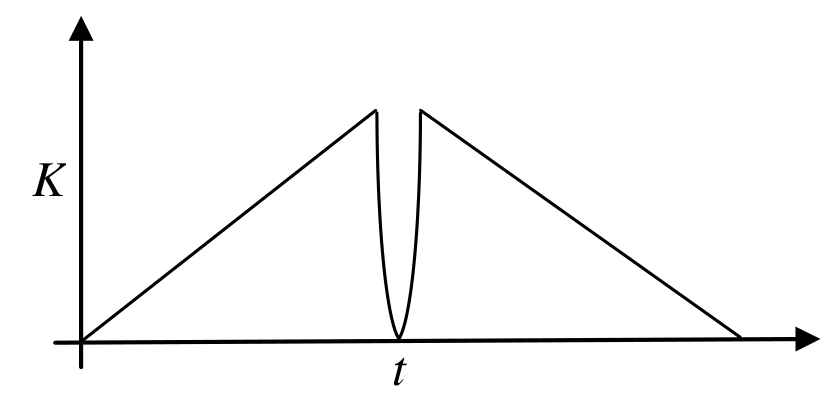
A tennis ball is released onto a horizontal smooth surface and bounces back to its initial height after impact. The magnitude of the force exerted on the ball throughout the collision varies directly with the length of its compression. Which of the following graphs best represents the dependence of the kinetic energy of the ball on time ? (Diagrams are indicative and not drawn to scale).
Options
Topics & Concepts
Step-by-Step Solution
To determine the correct graph of kinetic energy versus time , let us analyze the motion of the ball in three distinct stages:
1. Free Fall (Downward Motion)
The ball is released from rest at . Under constant acceleration due to gravity , its velocity at any time before collision is given by:
The kinetic energy during this phase is:
Since , the graph of versus is a parabola that opens upwards (concave upwards / convex), with the slope increasing continuously with time:
2. During Collision
When the ball hits the ground, the restoring force exerted on it is proportional to its compression , i.e., . Hence, the ball undergoes a half-cycle of Simple Harmonic Motion (SHM).
During this time:
- The kinetic energy is converted into elastic potential energy of compression.
- At the moment of maximum compression, the velocity momentarily becomes zero (), so the kinetic energy reaches zero ().
- As the ball restores its shape, the elastic potential energy is converted back into kinetic energy, smoothly returning to its value prior to impact just as it leaves the surface.
3. Upward Motion (Ascent)
After rebounding with initial upward speed at time , the ball moves upwards under gravity with velocity:
The kinetic energy during this phase is:
This is again a parabolic curve opening upwards (), which decreases quadratically to zero as the ball reaches its maximum height.
Conclusion:
- The kinetic energy curves during both the fall and ascent must be parabolic and opening upwards (concave up).
- During the collision, the kinetic energy rapidly decreases to zero at maximum compression and then increases back.
This behavior corresponds uniquely to the graph shown in (B).
Correct Option: (B)