Interatomic Potential vs Distance Graph for Monoatomic Real Gas
Consider one mole of a monoatomic real gas that satisfies the relation , where represents a constant. Which curve accurately illustrates the relationship between interatomic potential and interatomic distance for this gas?
Options
Topics & Concepts
Step-by-Step Solution
To determine the correct curve illustrating the relationship between the interatomic potential and the interatomic distance , we analyze the given equation of state for one mole of the real gas:
Step 1: Comparison with the van der Waals Equation
The general van der Waals equation of state for one mole of a real gas is given by:
where:
- accounts for the intermolecular attractive forces.
- accounts for the finite size of the molecules, giving rise to short-range repulsive forces (excluded volume).
Comparing with the van der Waals equation, we get:
Step 2: Physical Interpretation of and
-
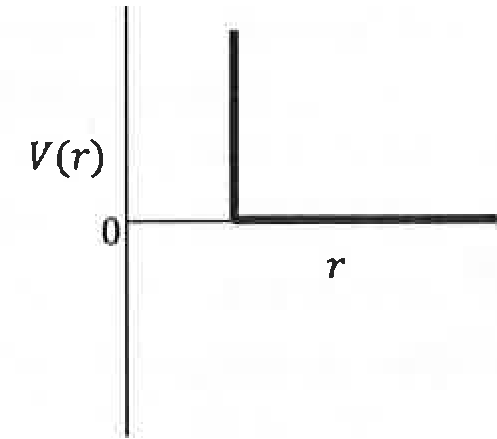
No Attractive Forces (): Since , there are no attractive forces acting between the atoms at any distance . Consequently, the interatomic potential energy is zero for all non-overlapping distances (, where is the atomic diameter/collision diameter):
-
Hard-Sphere Repulsion (): The presence of indicates that atoms have a finite volume and behave as hard spheres. When the interatomic distance becomes less than the atomic diameter (), an infinitely large repulsive force acts between them to prevent penetration. Thus, the potential energy steeply rises to infinity:
Step 3: Hard-Sphere Potential Model
Combining these two conditions yields the hard-sphere potential function:
Step 4: Conclusion and Graph Selection
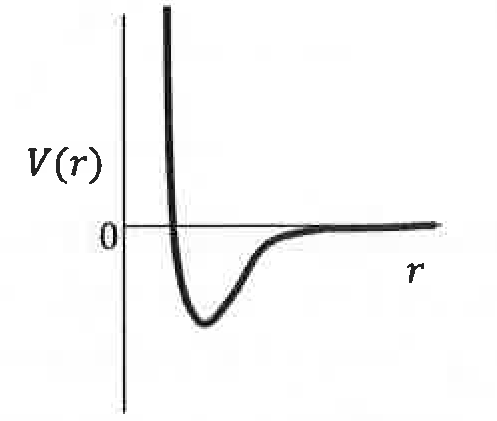
- Graph (A) represents a Lennard-Jones potential with both attraction () and repulsion ().
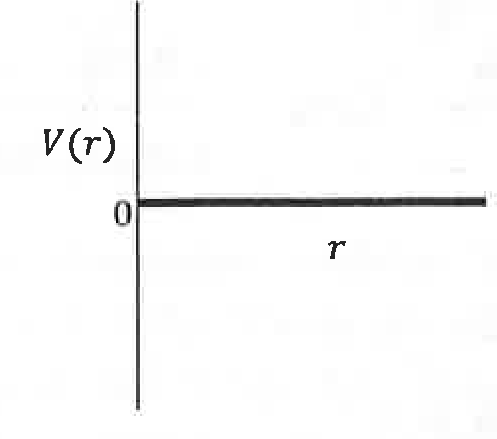
- Graph (B) represents an ideal gas with no interatomic forces and zero size ().
- Graph (C) represents the hard-sphere potential model where for and for .
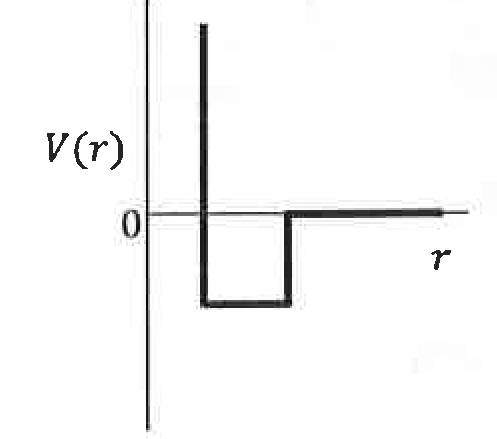
- Graph (D) represents a square-well potential with an attractive well.
Therefore, Graph (C) accurately represents the given system.
Correct Option: C