Frequency Distribution of Sound Intensity in Train A
Two trains and are moving with speeds and respectively in the same direction on the same straight track, with ahead of . The engines are at the front ends. The engine of train blows a long whistle.
Assume that the sound of the whistle is composed of components varying in frequency from to . The speed of sound in still air is .
The distribution of the sound intensity of the whistle as observed by the passengers in train A is best represented by
Options
Topics & Concepts
Step-by-Step Solution
Based on the problem setup and the principles of the Doppler effect:
-
Relative Motion Between Source and Observer:
The whistle (sound source) is mounted on train A, and the passengers observing the sound are also in train A. Therefore, there is no relative motion between the source and these observers:
-
Absence of Doppler Shift:
Since the source of sound and the passengers in train A are at rest relative to each other, no Doppler frequency shift occurs for any emitted frequency. -
Frequency Distribution:
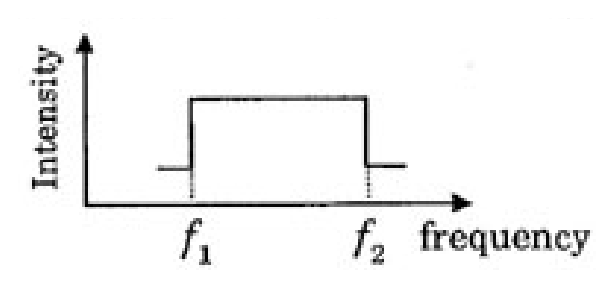
If the whistle emits a continuous distribution of sound frequencies with uniform intensity between the bounds and , the observed frequency range will remain completely unchanged. That is, the sound intensity begins precisely at and ends precisely at .
Examining the given plots of Intensity versus frequency:
- In (A), the rectangular pulse of intensity starts sharply at and terminates at , representing zero frequency shift.
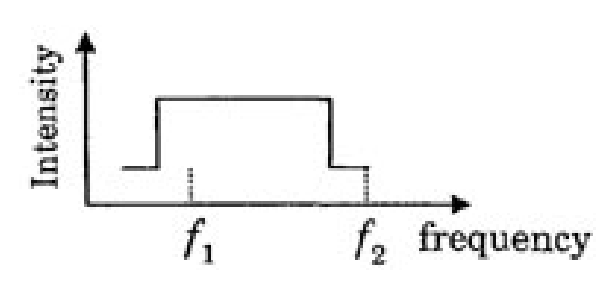
- In (B), the frequencies are shifted to lower values.
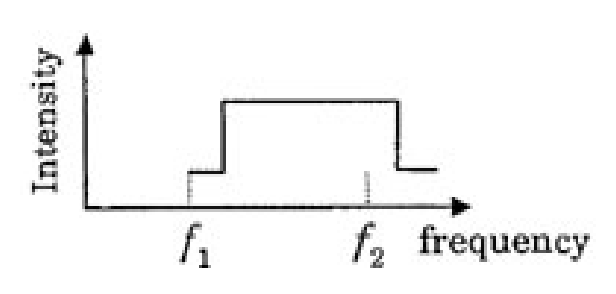
- In (C), the frequencies are shifted to higher values.
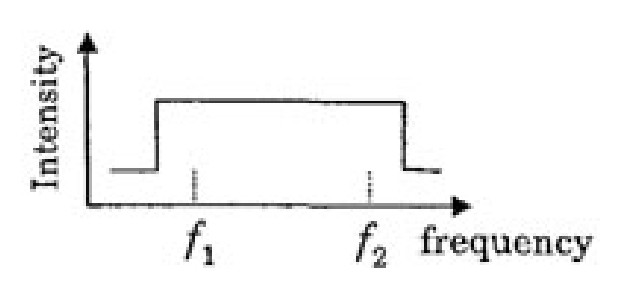
- In (D), the frequency bandwidth is stretched.
Thus, the observed intensity distribution in train A is correctly depicted in (A).