Correct Reaction Plots for Nucleophilic Substitution Kinetics
Identify which of the following graph plots is(are) accurate for the given chemical transformation? ( represents the initial concentration of reactant )
Options
Step-by-Step Solution
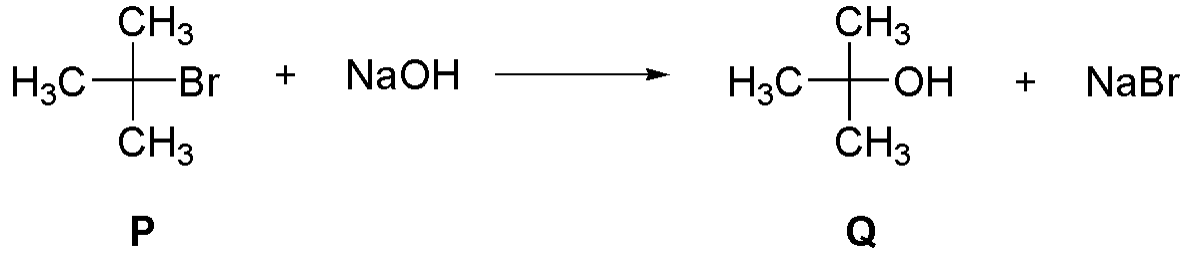
The given chemical reaction is the hydrolysis of a tertiary alkyl halide (tert-butyl bromide):
Here, reactant is tert-butyl bromide, and product is tert-butyl alcohol.
1. Kinetic Analysis of the Reaction
Tertiary alkyl halides undergo nucleophilic substitution predominantly via the mechanism (unimolecular nucleophilic substitution) due to the formation of a stable tertiary carbocation intermediate .
The rate-determining step is the unimolecular ionization of :
Thus, the reaction follows first-order kinetics with respect to : where is the first-order rate constant.
The integrated rate equation for a first-order reaction is:
2. Evaluation of the Options
-
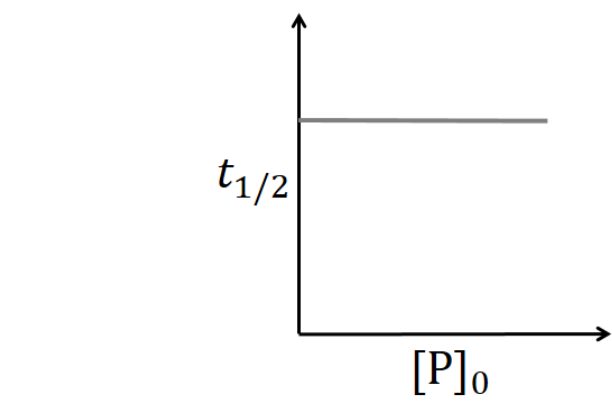
Option (A): Plot of vs The half-life () of a first-order reaction is calculated as: Since is independent of the initial concentration , the plot of versus is a horizontal straight line parallel to the axis. Hence, Option (A) is CORRECT.
-
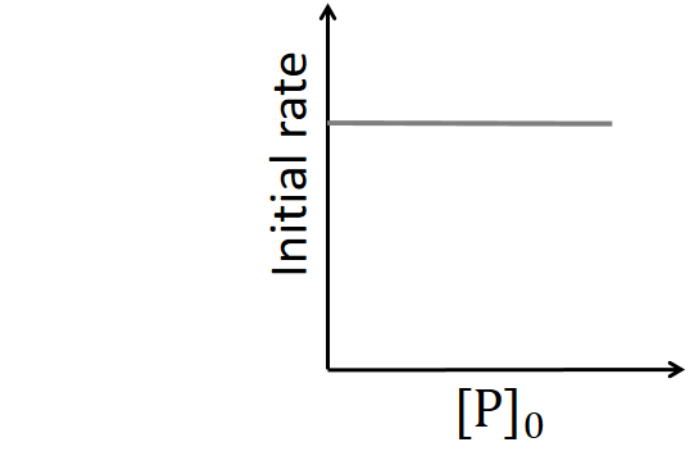
Option (B): Plot of Initial rate vs The initial rate of a first-order reaction is given by: This indicates a linear relationship passing through the origin with a positive slope . Plot (B) depicts a horizontal line (indicative of zero-order kinetics), which is incorrect for an reaction. Hence, Option (B) is INCORRECT.
-
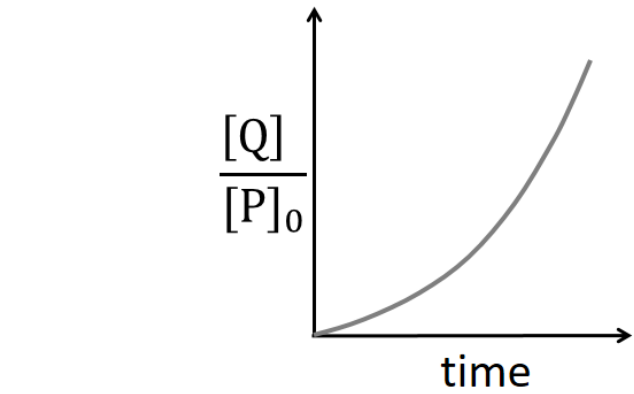
Option (C): Plot of vs time By stoichiometry, the concentration of product formed at time is: Rearranging gives: Taking the first and second derivatives with respect to time : Since the second derivative is negative for all , the graph must be concave downward (slope decreases over time). Plot (C) depicts a concave upward curve. Hence, Option (C) is INCORRECT.
-
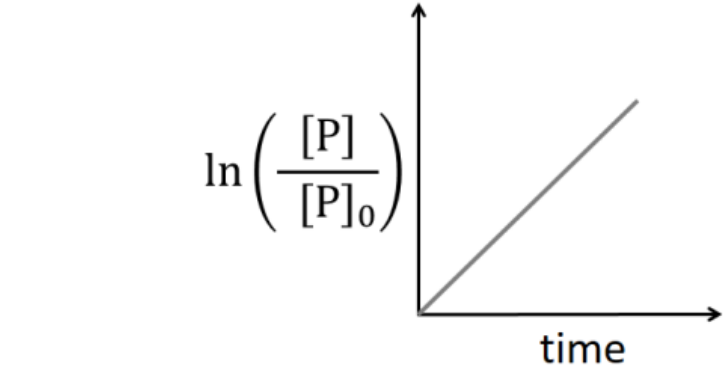
Option (D): Plot of vs time Taking the natural logarithm of : This represents a straight line passing through the origin with a negative slope (). Plot (D) shows a straight line with a positive slope. Hence, Option (D) is INCORRECT.
Conclusion
The only correct graph is given in option (A).