Yield of Ammonia as Function of Time at Different Temperatures
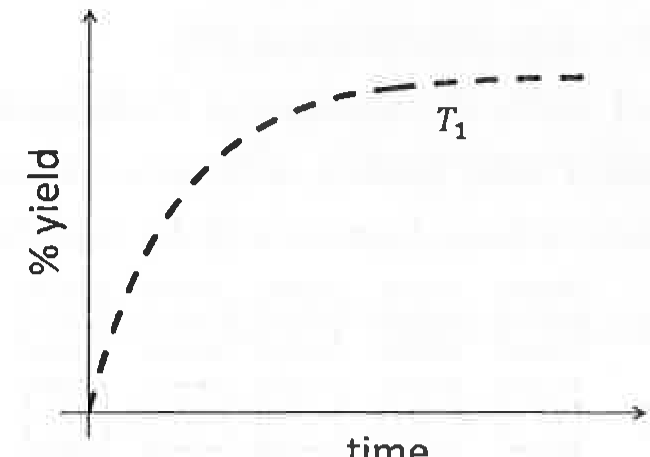
Consider the chemical equilibrium for ammonia formation: The plot below depicts the percent yield of ammonia as a function of time under conditions .
If the reaction is instead performed at where , which of the following curves correctly illustrates the percent yield of ammonia over time?
Options
A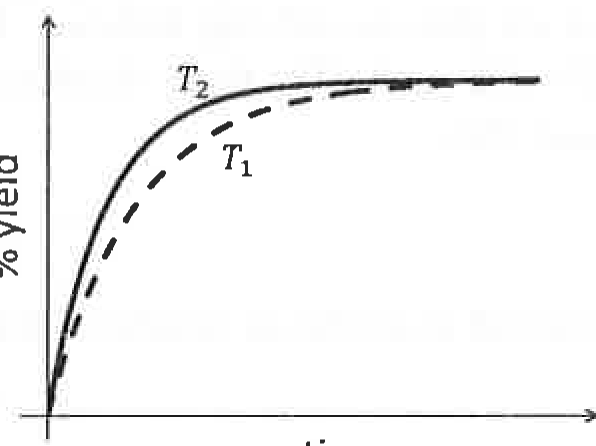
B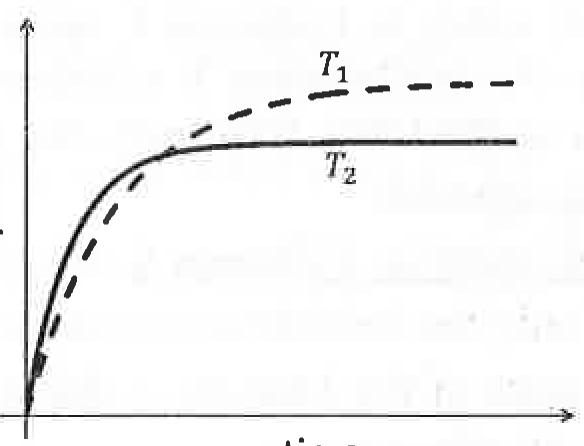 Correct
C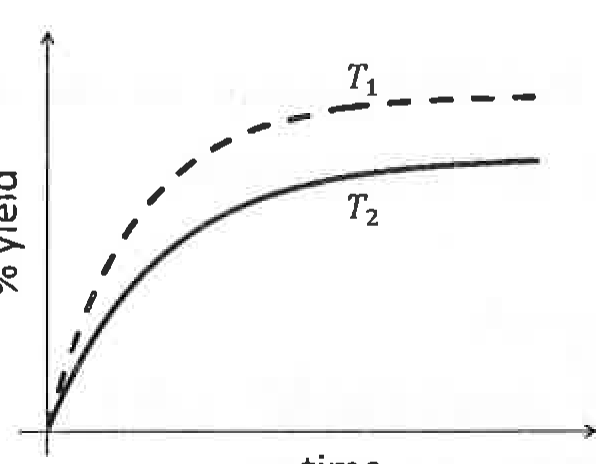
D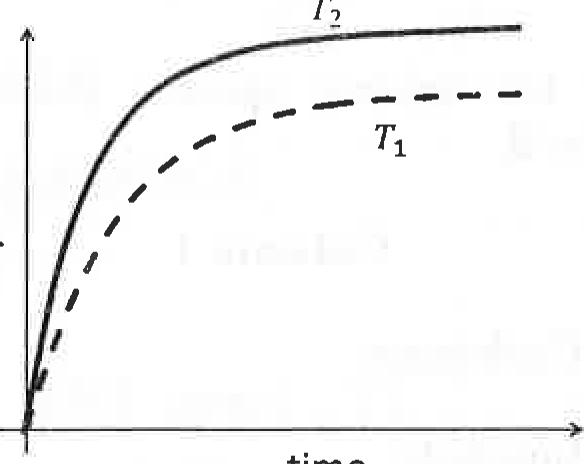
Topics & Concepts
Step-by-Step Solution
To determine the correct curve representing the percent yield of ammonia over time at temperature (), we need to analyze both the kinetic and thermodynamic aspects of the reaction:
1. Kinetic Aspect (Effect on Reaction Rate):
- According to the Arrhenius equation, the rate constant is given by:
- As temperature increases from to (), the kinetic energy of the molecules increases, increasing the frequency of effective collisions.
- Consequently, the initial rate of the reaction is faster at higher temperature . Thus, the initial slope of the percent yield vs. time curve for will be steeper than that for , meaning the curve for initially lies above the curve for .
2. Thermodynamic Aspect (Effect on Equilibrium Yield):
- The formation of ammonia is an exothermic reaction ().
- According to the van 't Hoff equation:
- Since , an increase in temperature causes the equilibrium constant to decrease ().
- According to Le Chatelier's principle, increasing the temperature shifts the equilibrium in the backward (endothermic) direction to absorb heat.
- Therefore, the equilibrium yield (maximum percentage yield at ) of at will be lower than at .
Conclusion:
The curve for must:
- Rise faster initially (higher rate of reaction, steeper slope at small ).
- Level off at a lower final plateau than (lower equilibrium yield).
This behavior is correctly depicted in Option (B).
Correct Answer: (B)