Surface Tension Variation with Concentration for Aqueous Solutions
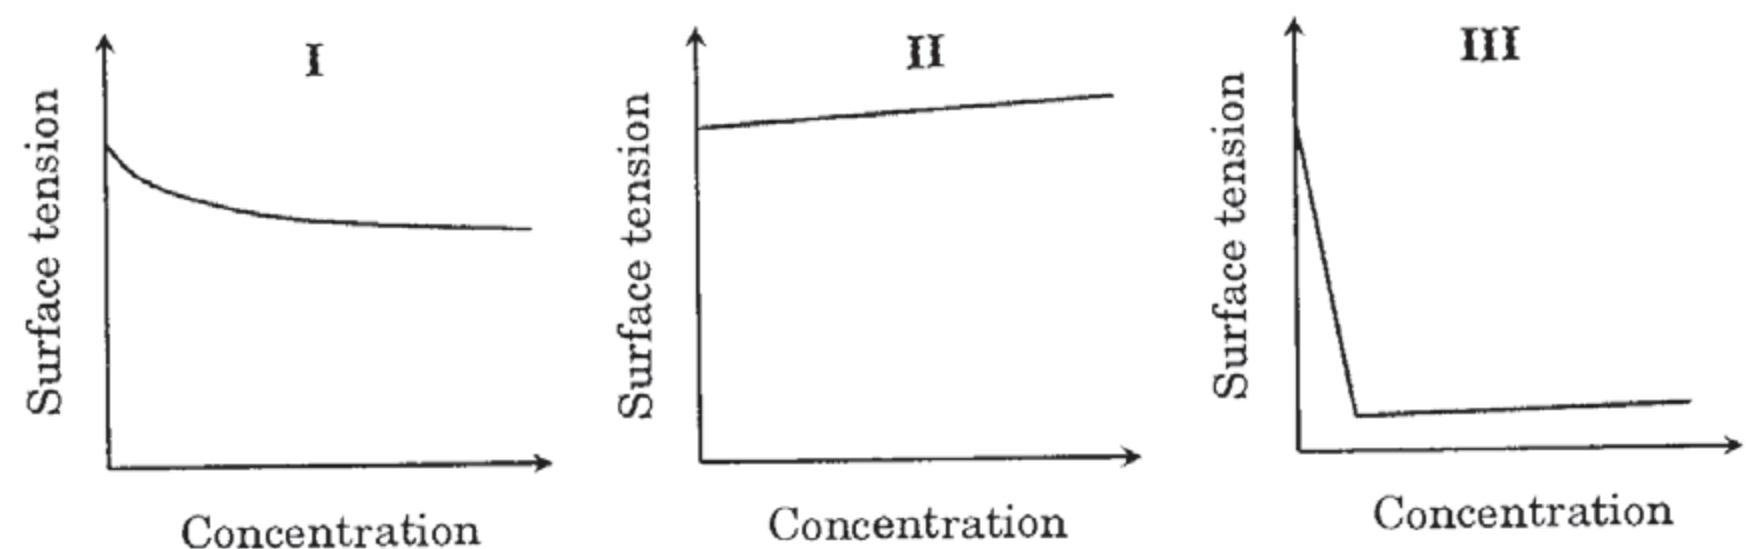
The qualitative graphs , , and provided below display how surface tension varies with molar concentration for three distinct aqueous solutions of , , and at room temperature. Select the correct assignment of these sketches:
Options
A
, ,
B
, ,
C
, ,
DCorrect
, ,
Topics & Concepts
Step-by-Step Solution
To determine the correct assignment of the qualitative graphs , , and , we analyze the surface activity and thermodynamic behavior of each solute in water based on the Gibbs Adsorption Isotherm:
where is the surface excess concentration, is the surface tension, is the universal gas constant, is the temperature, and is the activity (or concentration ) of the solute.
1. Inorganic Electrolytes ()
- Ions such as and are strongly hydrated by water molecules in the bulk solution and are repelled from the air-water interface due to image forces and preferential hydration in the bulk.
- Since solute concentration at the surface is less than in the bulk liquid (), it follows from the Gibbs adsorption equation that:
- Therefore, the addition of leads to a slight and continuous increase in the surface tension of water with concentration.
- This behavior corresponds to Graph .
2. Non-micelle-forming organic compounds ()
- Methanol () possesses a hydrophobic methyl group and a hydrophilic hydroxyl group.
- It accumulates at the surface (), reducing the surface tension continuously as concentration increases ().
- Unlike long-chain surfactants, methanol does not undergo micellization at low concentrations, so the decrease in surface tension is gradual and smooth without a sharp break point.
- This behavior corresponds to Graph .
3. Surfactants with long hydrocarbon chains ()
- Sodium dodecyl sulfate (SDS) is an amphiphilic surfactant with a long hydrophobic tail.
- It strongly adsorbs at the air-water interface, resulting in a dramatic and steep drop in surface tension even at very low concentrations.
- At the Critical Micelle Concentration (CMC), the interface becomes completely saturated with surfactant molecules. Further addition of surfactant leads to micelle formation in the bulk phase rather than additional surface adsorption. Consequently, the surface tension remains nearly constant beyond the CMC.
- This sharp decrease followed by a constant surface tension curve corresponds to Graph .
Conclusion:
This corresponds to Option D.