Ratio of Standard Gibbs Energy at Different Temperatures from Pressure-Time Plot
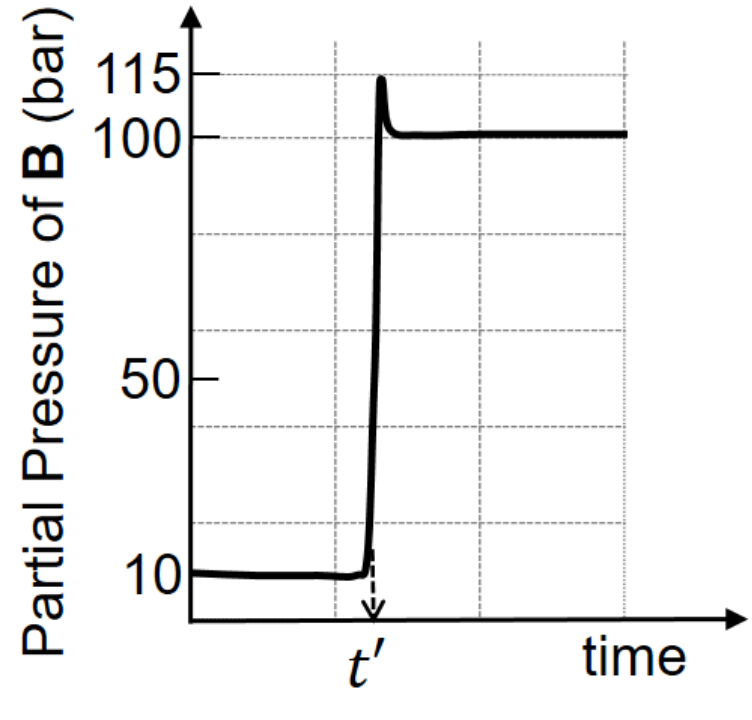
For the reversible reaction at , the temperature of the reaction system is increased to at time and allowed to attain a new state of equilibrium. Throughout the experiment, the partial pressure of component is maintained constant at . Below is the plot displaying the variation of the partial pressure of with respect to time. Calculate the ratio of the standard Gibbs energy change of the reaction at to that at .
Topics & Concepts
Step-by-Step Solution
For the given reversible reaction:
The equilibrium constant in terms of partial pressures, , is expressed as:
Throughout the experiment, the partial pressure of component is maintained constant at:
Step 1: Analysis at Before time , the reaction system is at equilibrium at . From the provided plot, the equilibrium partial pressure of is:
Thus, the equilibrium constant at is:
The standard Gibbs energy change at is given by:
Step 2: Analysis at After time , the temperature is raised to and the system attains a new state of equilibrium. From the plot, the new equilibrium partial pressure of is:
Thus, the equilibrium constant at is:
The standard Gibbs energy change at is given by:
Step 3: Ratio of Standard Gibbs Energy Changes The ratio of the standard Gibbs energy change at to that at is: