Isothermal and Adiabatic Expansion Plots for Ideal Gas
An ideal gas experiences a reversible isothermal expansion from state to state , which is then followed by a reversible adiabatic expansion from state to state . Identify the correct plot(s) depicting these state transitions from state to state .
(: pressure, : volume, : temperature, : enthalpy, : entropy)
Options
A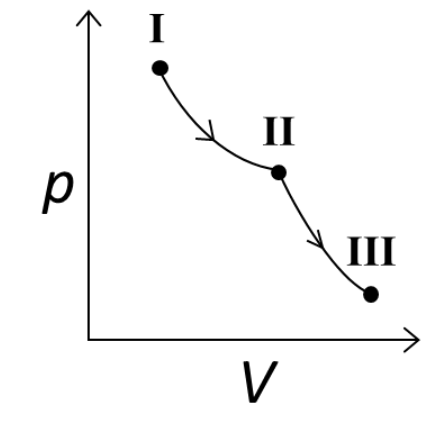 Correct
B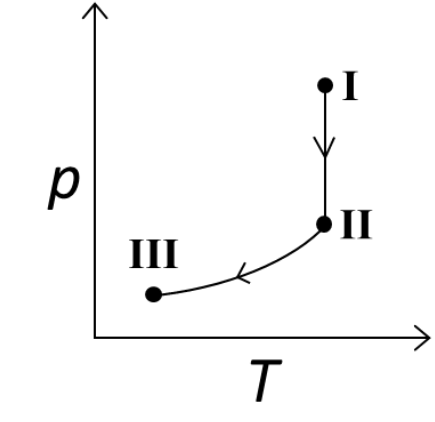 Correct
C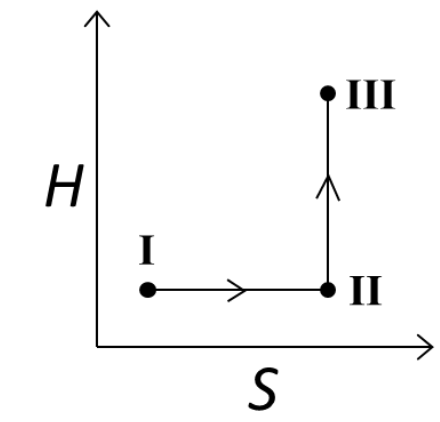
D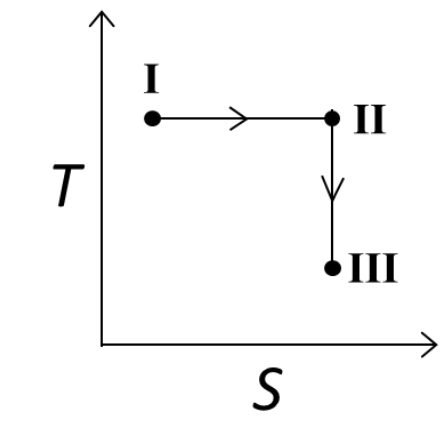 Correct
Step-by-Step Solution
To determine the correct graphical representations of the given state transitions, let us analyze the changes in the thermodynamic variables () for each step:
1. Process : Reversible Isothermal Expansion
- Temperature (): Remains constant, so .
- Volume () and Pressure (): Expansion implies . Since at constant temperature, pressure decreases ().
- Enthalpy (): For an ideal gas, enthalpy depends only on temperature (). Since is constant, .
- Entropy (): The entropy change during a reversible isothermal expansion is given by:
2. Process : Reversible Adiabatic Expansion
- Entropy (): For a reversible adiabatic process, , which means it is an isentropic process ().
- Volume () and Work (): Expansion implies , so work done by the gas is positive ().
- Internal Energy () and Temperature (): By the First Law of Thermodynamics, . Since internal energy decreases, the temperature drops:
- Pressure (): As volume expands adiabatically, pressure decreases further ().
- Enthalpy (): Since for an ideal gas and , the enthalpy decreases:
3. Evaluation of the Options
-
Option (A) — vs Plot:
- : Isothermal expansion shows a curve going downwards to the right ().
- : Adiabatic expansion shows a curve going downwards to the right with a steeper slope (, where ).
- Volume continuously increases from to .
- (A) is CORRECT.
-
Option (B) — vs Plot:
- : Temperature is constant while pressure decreases. This corresponds to a vertical line pointing downwards.
- : Both pressure and temperature decrease. This corresponds to a curve moving down and to the left.
- (B) is CORRECT.
-
Option (C) — vs Plot:
- : is constant while increases (horizontal line to the right).
- : is constant while decreases due to cooling (vertical line pointing downwards).
- Option (C) incorrectly shows increasing (vertical line pointing upwards from to ).
- (C) is INCORRECT.
-
Option (D) — vs Plot:
- : Temperature is constant while entropy increases (horizontal line to the right).
- : Entropy is constant while temperature decreases (vertical line pointing downwards).
- (D) is CORRECT.
Correct Options:
(A), (B), (D)