Half Life Period Determination from Initial Concentration Graph
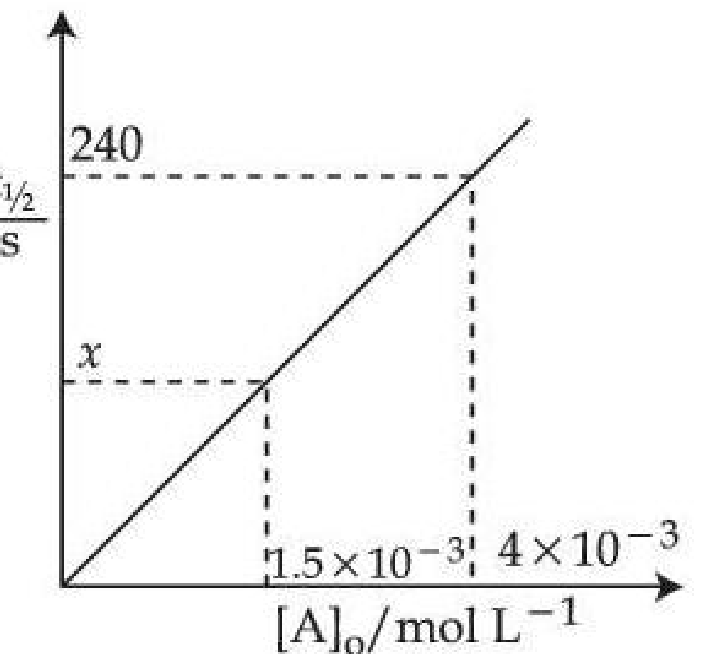
For a reaction at , the half life () is plotted as a function of initial concentration of as given below. The value of in the given figure is ____________ (Nearest integer)
Official Numerical Answer90
Topics & Concepts
Step-by-Step Solution
From the given graph of half-life () versus initial concentration (), the plot is a straight line passing through the origin.
This indicates that the half-life is directly proportional to the initial concentration , which is characteristic of a zero-order reaction:
Thus, the ratio of half-life to initial concentration is constant:
Using the coordinates from the graph:
- For ,
- For ,
Setting up the proportion:
Solving for :
The value of is .