Graphical Representations for First Order Reaction Kinetics
For a first-order reaction at a given temperature, is the rate constant. For this reaction, at the given temperature, the concentrations of and at a time are and , respectively. The correct graphical representation(s) for this reaction is(are)
Options
Topics & Concepts
Step-by-Step Solution
For a first-order elementary reaction with rate constant :
-
Integrated Rate Law: The rate of disappearance of reactant is given by: Integrating this differential equation yields: where is the initial concentration of at .
-
Concentration of Product : Since , we have:
Analysis of Options:
-
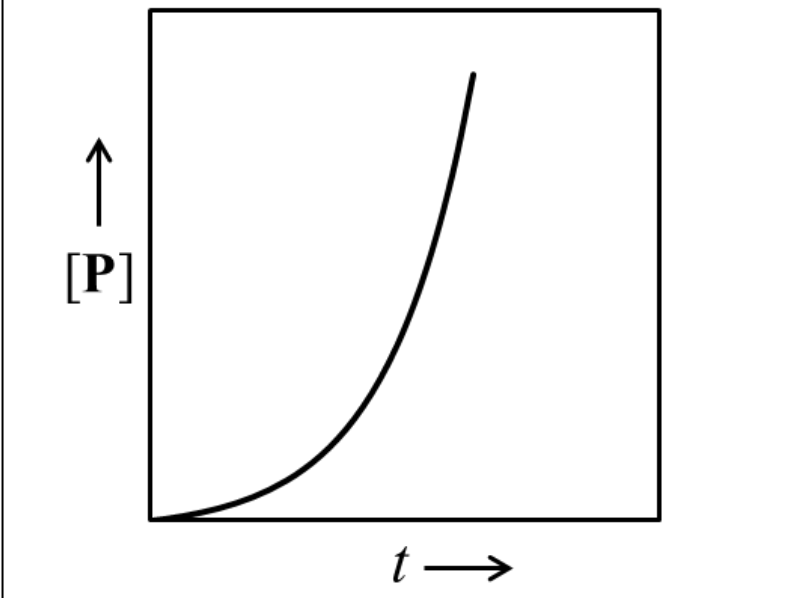
Option (A): Taking the first and second derivatives of with respect to time : Since the second derivative is negative (), the graph of vs must be concave downwards (it increases initially and then levels off asymptotically to ). Graph (A) shows a concave upwards curve, which is incorrect.
-
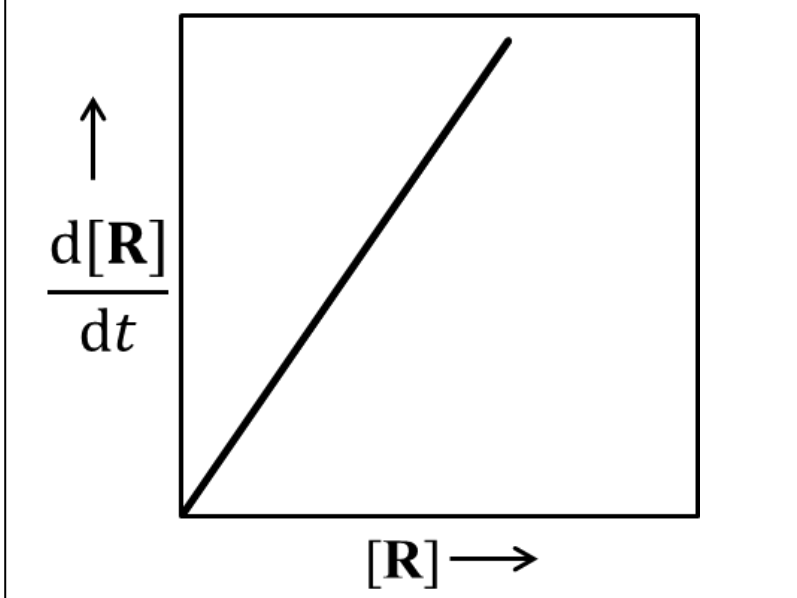
Option (B): The rate of change of concentration of is: A plot of versus is a straight line passing through the origin with a negative slope (). Graph (B) shows a positive slope, which is incorrect.
-
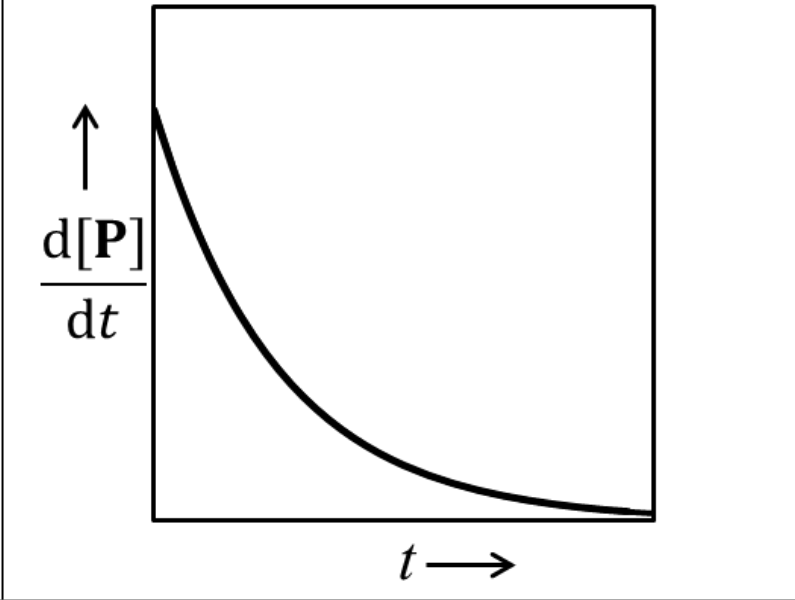
Option (C): The rate of formation of product is: This shows that decreases exponentially with time from an initial maximum value of at towards zero as . Graph (C) correctly represents this exponential decay, so option (C) is correct.
-
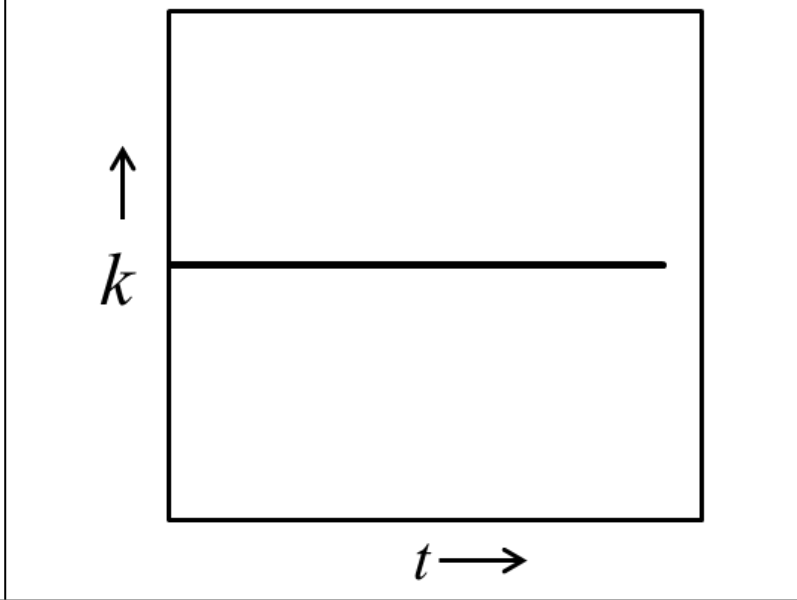
Option (D): The rate constant depends only on temperature and is independent of time or concentration. Thus, at a given temperature, a plot of versus is a horizontal straight line parallel to the time axis. Graph (D) correctly represents this, so option (D) is correct.
Correct Answer: The correct options are C and D.