Conductometric Titration Plot of Silver Nitrate with Potassium Chloride
was added to an aqueous solution gradually and the conductivity of the solution was measured. The plot of conductance versus the volume of is
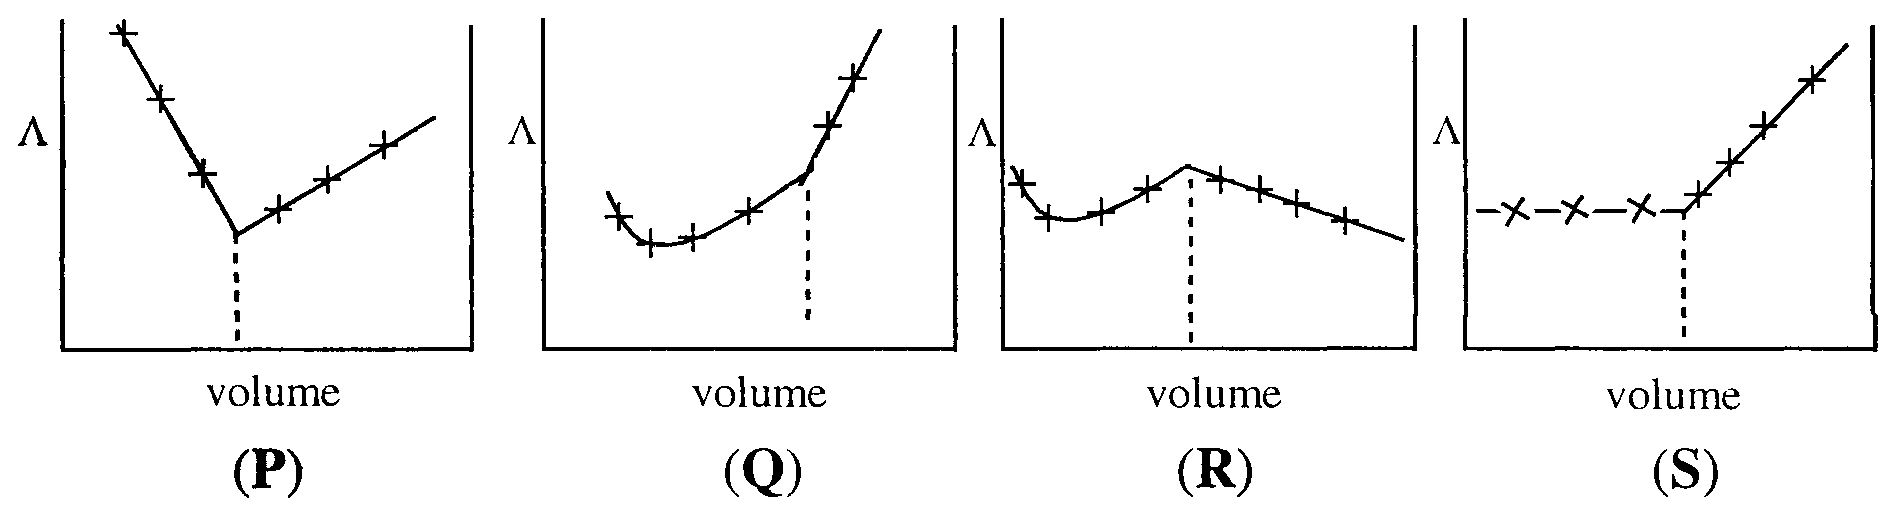
Options
A
()
B
()
C
()
DCorrect
()
Topics & Concepts
Step-by-Step Solution
To determine the variation of conductance () of the solution as aqueous is added to an aqueous solution, we analyze the ionic species present in the solution at different stages of the titration:
-
Before the equivalence point:
The precipitation reaction that takes place is:
- ions act as spectator ions and remain in the solution.
- For every ion precipitated as insoluble , one ion is introduced into the solution.
- The limiting molar ionic conductivities of and are very close to each other:
- Since the mobility of the outgoing ion is nearly identical to that of the incoming ion, the total conductance of the solution remains almost constant (represented by a nearly horizontal line).
-
After the equivalence point:
- All the ions have completely reacted and precipitated as .
- Subsequent addition of merely introduces additional and ions into the solution without any further precipitation.
- The increase in the total concentration of ions causes the conductance to increase sharply and linearly with the volume of added.
Therefore, the conductance curve remains essentially flat up to the equivalence point and then increases steeply, which corresponds to graph (S).
Hence, the correct option is (D).