Conductometric Titration Curves Matching for Ionic Conductivities
In a conductometric titration, small volume of titrant of higher concentration is added stepwise to a larger volume of titrate of much lower concentration, and the conductance is measured after each addition.
The limiting ionic conductivity () values (in ) for different ions in aqueous solutions are given below:
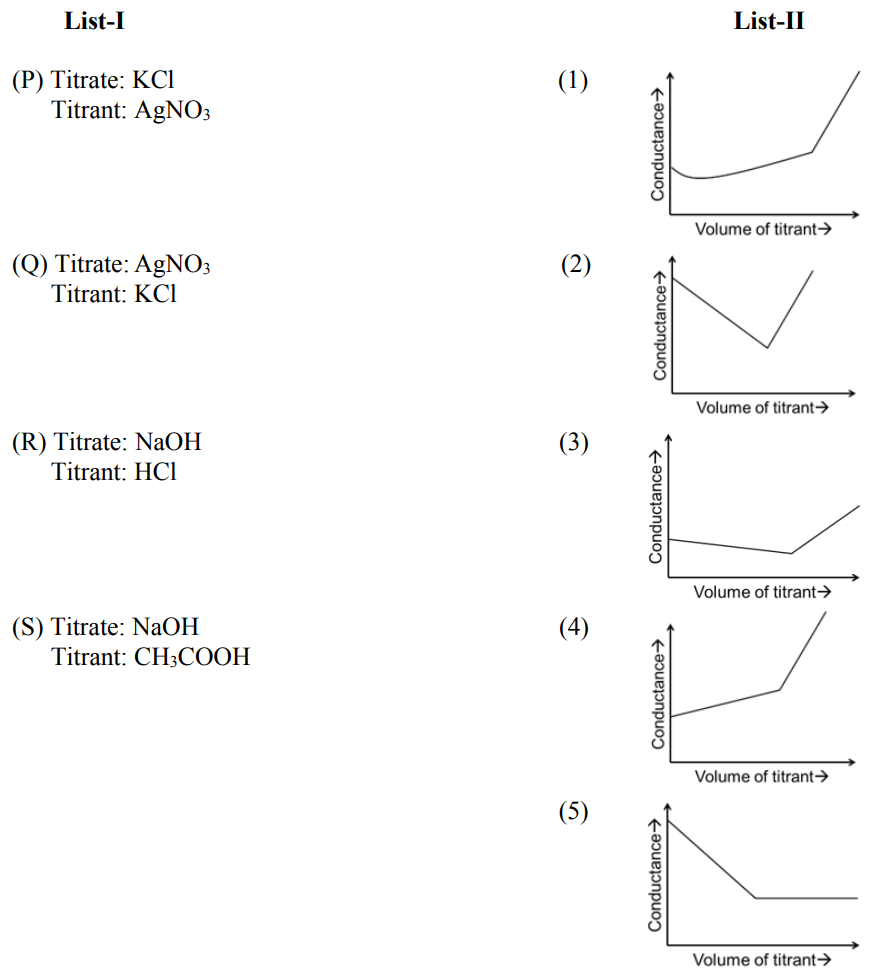
For different combinations of titrates and titrants given in List-I, the graphs of ‘conductance’ versus ‘volume of titrant’ are given in List-II.
Match each entry in List-I with the appropriate entry in List-II and choose the correct option.
Options
P-4, Q-3, R-2, S-5
P-2, Q-4, R-3, S-1
P-3, Q-4, R-2, S-5
P-4, Q-3, R-2, S-1
Topics & Concepts
Step-by-Step Solution
To determine the correct matching between the titrations in List-I and the conductance curves in List-II, we analyze the change in total ionic conductance before and after the equivalence point for each case using the given limiting ionic conductivities ().
1. Pair (P): Titrate , Titrant
-
Before Equivalence Point:
The precipitation reaction occurring in solution is: As is added, ions are replaced by ions while ions remain unchanged.
The net change in conductivity per mole of added titrant is: Since , the conductance decreases slightly before the equivalence point. -
After Equivalence Point:
Adding excess introduces unreacted and ions into the solution.
The change in conductivity per mole of added titrant is: Thus, the conductance increases after the equivalence point. -
Matching Graph: This behavior (slight decrease followed by an increase) corresponds to Graph (3).
2. Pair (Q): Titrate , Titrant
-
Before Equivalence Point:
The precipitation reaction occurring in solution is: As is added, ions are replaced by ions while ions remain unchanged.
The net change in conductivity per mole of added titrant is: Since , the conductance increases slightly before the equivalence point. -
After Equivalence Point:
Adding excess introduces unreacted and ions.
The change in conductivity per mole of added titrant is: Thus, the conductance increases at a steeper slope after the equivalence point. -
Matching Graph: This behavior (slight increase followed by a steeper increase) corresponds to Graph (4).
3. Pair (R): Titrate , Titrant
-
Before Equivalence Point:
The neutralization reaction is: ions are replaced by ions.
The net change in conductivity per mole of added titrant is: This results in a steep decrease in conductance before the equivalence point. -
After Equivalence Point:
Adding excess strong acid introduces highly conducting ions along with ions: This leads to a steep increase in conductance. -
Matching Graph: This forms a classic V-shaped curve, corresponding to Graph (2).
4. Pair (S): Titrate , Titrant
-
Before Equivalence Point:
The neutralization reaction is: ions are replaced by ions.
The net change in conductivity per mole of added titrant is: This causes a steep decrease in conductance before the equivalence point. -
After Equivalence Point:
Excess weak acid is added. Due to the presence of acetate ions () from the salt formed, further dissociation of the weak acid is suppressed by the common-ion effect. Thus, the concentration of free ions remains practically constant, causing the curve to become nearly horizontal/flat. -
Matching Graph: This behavior corresponds to Graph (5).
Summary of Matching:
This corresponds to Option (C).