Concentration versus Time Graph for Reversible First Order Reaction
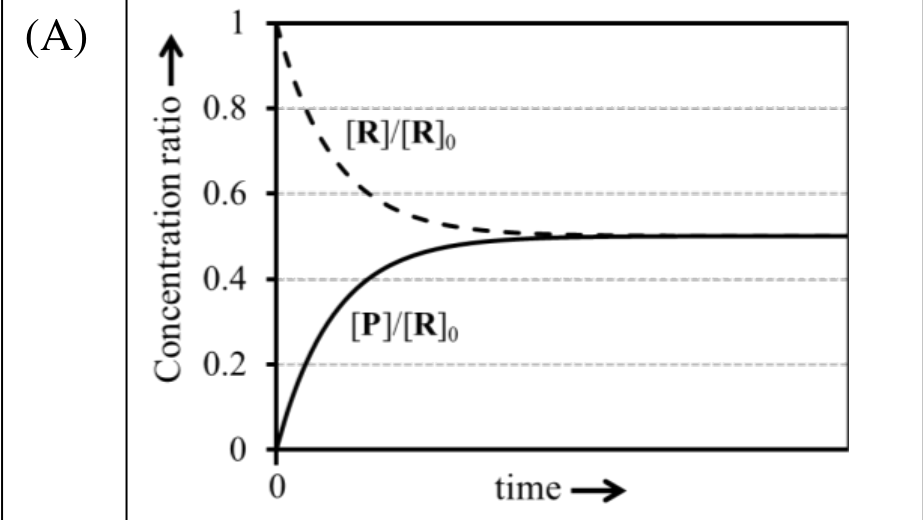
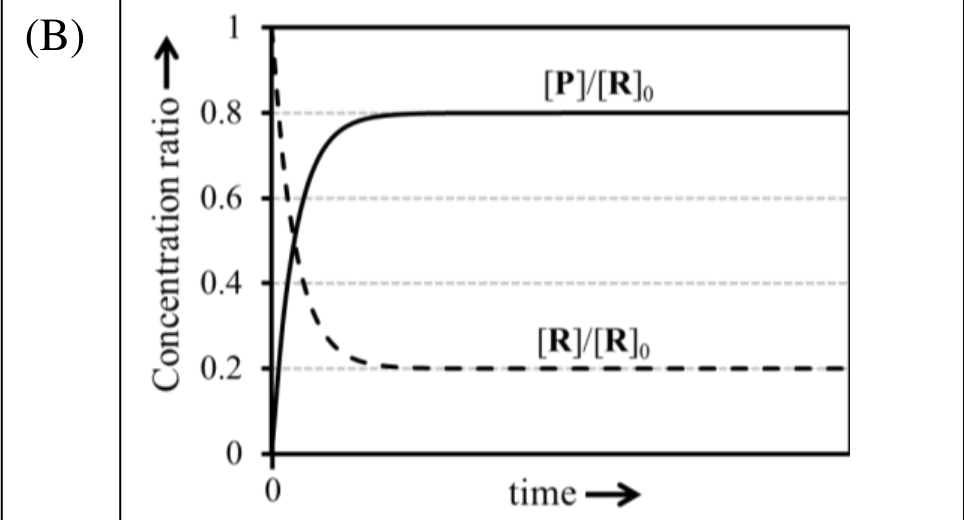
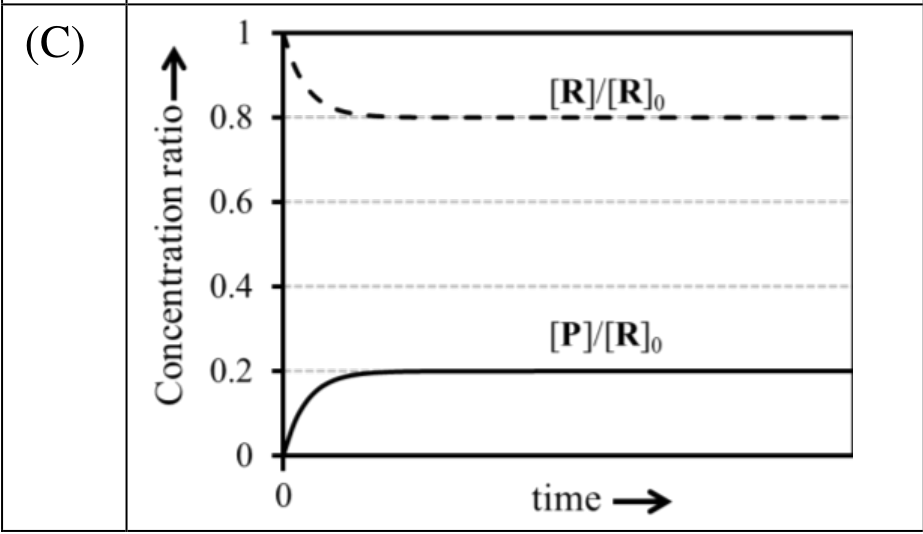
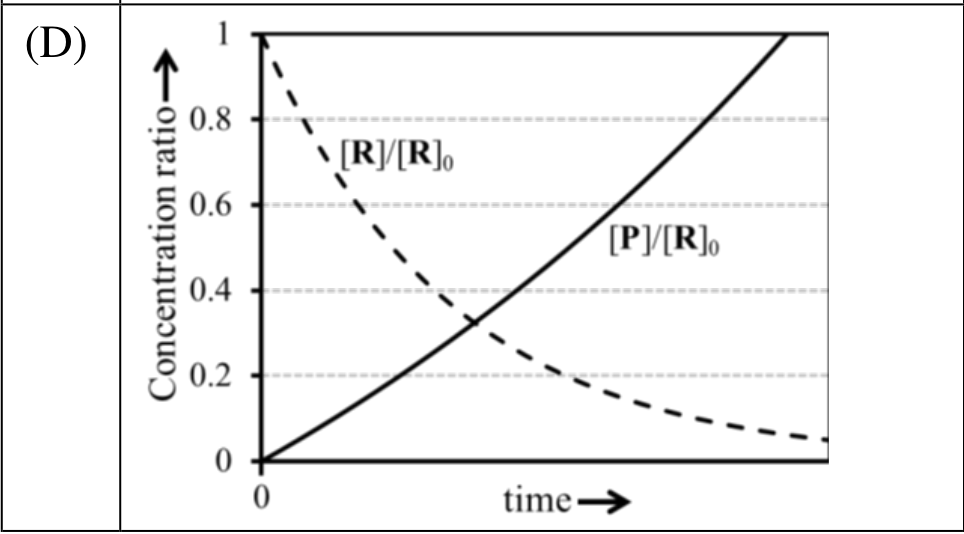
For a reversible reaction , at constant temperature, both the forward and the backward reactions are first order elementary reactions with rate constants and , respectively. At time zero, the concentration of is and the concentration of is zero. At any given time, and are the concentrations of and , respectively. If , the correct graphical representation of the reaction is
Options
Topics & Concepts
Step-by-Step Solution
To determine the correct graphical representation for the given reversible reaction , we can analyze the concentration ratios at initial state () and at equilibrium ().
1. Initial Conditions ()
At time :
2. Conservation of Mass
By the law of conservation of mass, at any time :
Dividing throughout by :
3. Equilibrium Conditions ()
At dynamic equilibrium, the rate of the forward reaction equals the rate of the backward reaction:
Given that , we substitute this into the equilibrium rate expression:
Using the mass conservation relation at equilibrium:
Therefore, the equilibrium concentration ratios are:
4. Kinetics and Graph Characteristics
For a first-order reversible reaction, the concentration ratios approach their equilibrium values exponentially with time:
- The ratio starts at and exponentially decays towards .
- The ratio starts at and exponentially rises towards .
Comparing this behavior with the given options:
- Option (C) correctly shows approaching and approaching as time increases.
Correct Option: (C)