Activation Energy Temperature Coefficient and Half Life Graph
Given below are two statements :
and
Statement I : When , the room temperature rate constant is doubled by a increase in temperature ( to )
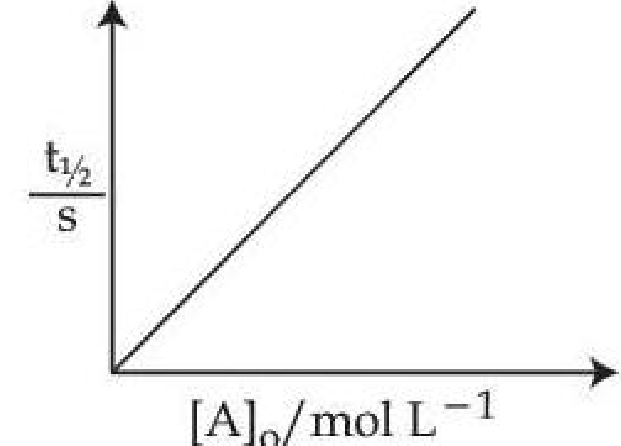
Statement II : For a first order reactions ,
Here is the initial concentration of and is half life of reaction. In the light of the above statements, choose the correct answer from the options given below :
Options
Both Statement I and Statement II are true
Both Statement I and Statement II are false
Statement I is true but Statement II is false
Statement I is false but Statement II is true
Topics & Concepts
Step-by-Step Solution
To determine the correctness of Statement I and Statement II, let us evaluate each statement individually.
Analysis of Statement I:
According to the Arrhenius equation, the temperature dependence of the rate constant is given by:
Given parameters:
- (since the rate constant is doubled)
- and
Substituting these values into the equation:
Since the calculated activation energy matches , Statement I is true.
Analysis of Statement II:
For a first-order reaction , the expression for half-life () is:
Notice that is completely independent of the initial concentration of reactant . Hence, a graph of against for a first-order reaction should be a horizontal straight line parallel to the x-axis.
The graph shown in Statement II depicts (a straight line passing through the origin), which represents a zero-order reaction (), not a first-order reaction.
Therefore, Statement II is false.
Conclusion:
- Statement I is true.
- Statement II is false.
Thus, the correct option is C.